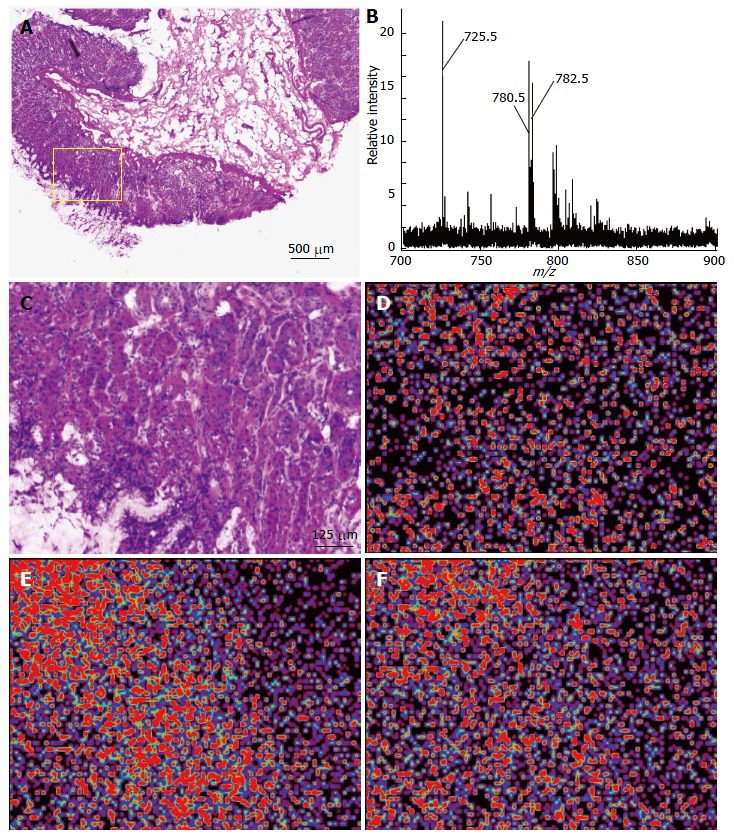
Figure 1.

Imaging mass spectrometry analysis of a gastric mucosa. A: HE staining of the gastric mucosa. Inset, ROI of the imaging analysis; B: Averaged spectra obtained from five gastric mucosae; C: Magnified view of the ROI represented in the inset of (A), HE; D: The ion at m/z 725.5; E: The ion at m/z 780.5; F: The ion at m/z 782.5 were imaged using BioMap.
