Fig. 2.
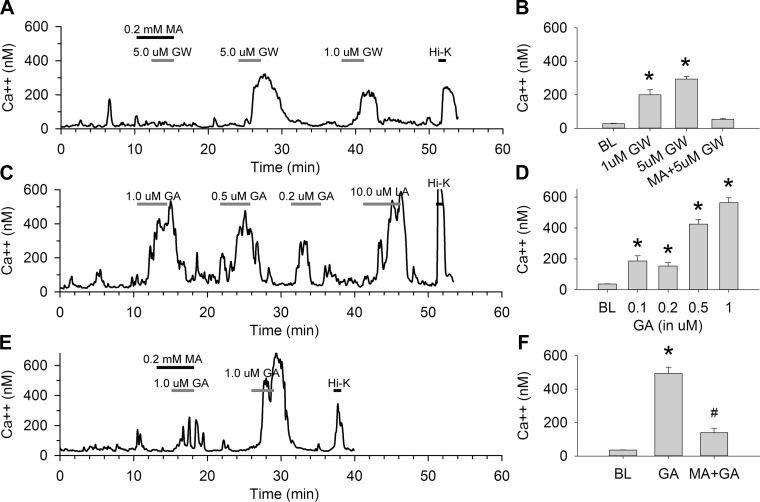
Effects of G protein-coupled receptor (GPR) 40 agonist GW-9508 (GW) and GPR120 agonist grifolic acid (GA) on [Ca2+]i in STC-1 cells. A and B: MA blocked increases in [Ca2+]i induced by the GPR40 agonist GW in STC-1 cells. A: trace showing responses of one STC-1 cell perfused with different concentrations of GW (1–5 μM) with or without MA (0.2 mM). B: averages of peak responses vs. BL. n = 29 cells/treatment. *P < 0.001 vs. BL. C and D: GA increased [Ca2+]i in STC-1 cells. C: trace showing responses of one STC-1 cell perfused with different concentrations of GA (0.1–1 μM) and LA (10 μM). D: averages of peak responses vs. BL. n = 14–57 cells/treatment. *P < 0.001 vs. BL. E and F: MA blocked increases in [Ca2+]i induced by GA in STC-1 cells. E: antagonistic effects of MA on [Ca2+]i in one STC-1 cell perfused with GA (1 μM), LA (5 μM) with or without pretreatment of MA (0.2 mM). F: averages of peak responses vs. BL. n = 22 cells/treatment. #P < 0.01 and *P < 0.001 vs. BL.

