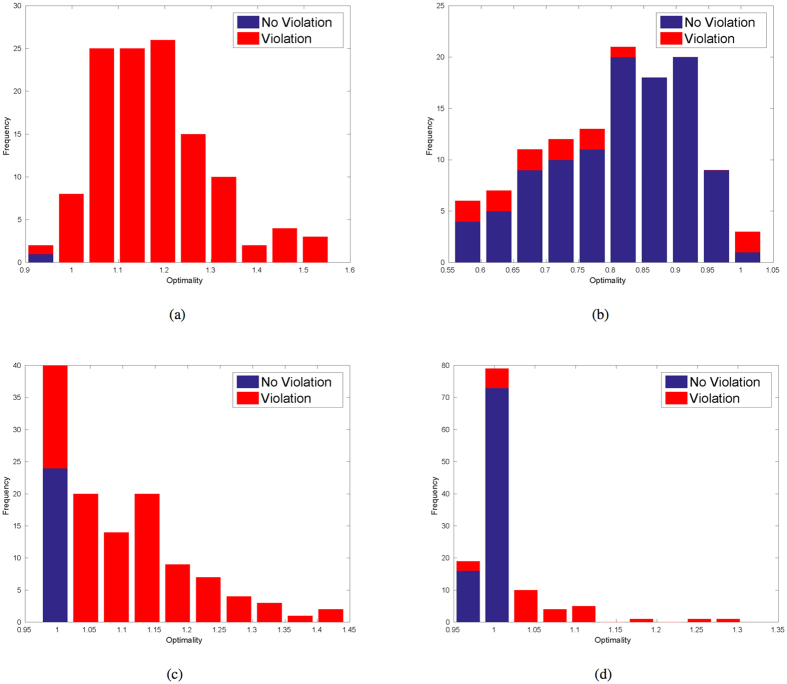
Figure 3. Number of violation (red) and nonviolation (blue) cases versus throughput optimality measure on test graph 2 (the harder instance).
D-Wave simulation runs are shown in (a,b). SA simulation runs shown in (c,d) are executed under the one set of optimal parameters we have tested (5000 sweeps, 5000 repetitions, linear schedule with initial temperature β0 = 0.1 and final temperature β1 = 10). Note that the abscissa of the blue vertical bars register Fquantum whereas the abscissa of the red vertical bars registers  as defined in supplemental material. (a) D-Wave: Before gap expansion; (b) D-wave: After gap expansion; (c) Simulated Annealing: Before gap expansion; (d) Simulated Annealing: After gap expansion.

