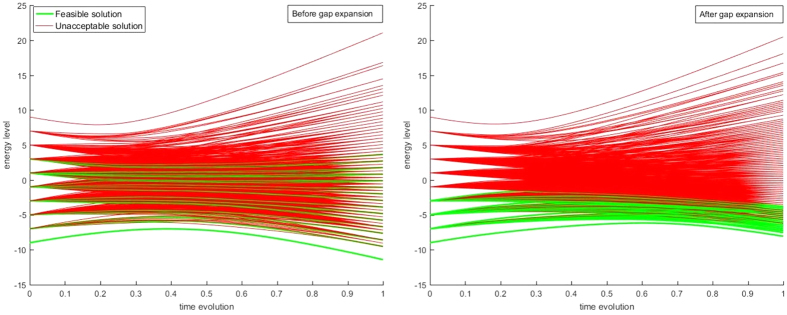
Figure 5. Hamiltonian energy level evolution with H(s) = (1 − s)Htrans + sHIsing, demonstrating the feasibility of energy compression on a small, randomly generated test wireless graph with 7 nodes on the conflict graph, plotting all 128 possible energy states in both before and after gap expansion cases.
Both Hamiltonians are rescaled to have a maximum energy level of 2 for both coupling strengths and local fields. Note that for a typical desktop computer, such plots are impossible to construct once the size of the conflict graph goes higher than 12.

