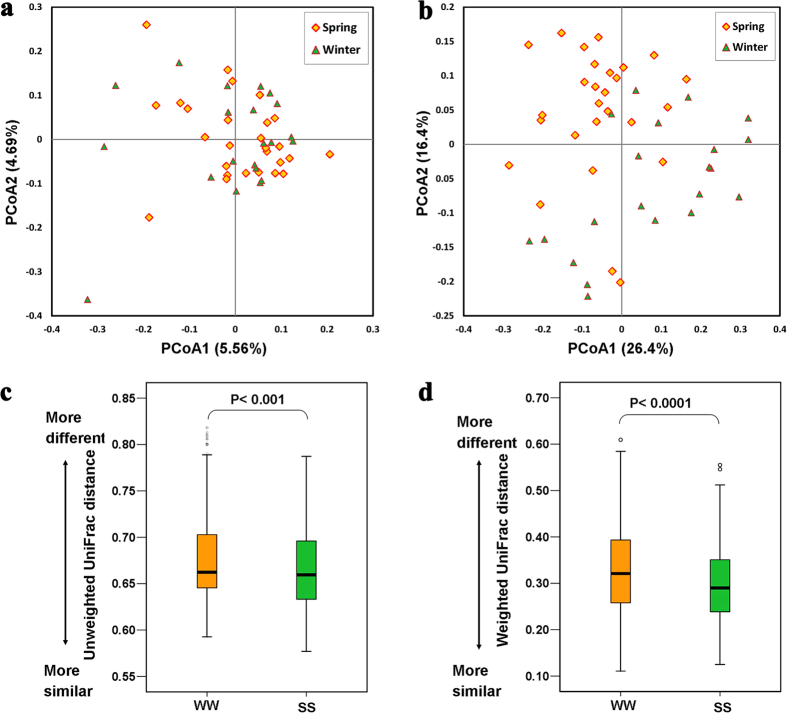
Figure 2. Gut microbiota structure differentiation and inter-individual similarity.
PCoA was used to show patterns of separation by season, Yellow: spring sample; green, winter sample; (a) based on unweighted UniFrac distance (Permanova, P < 0.05), (b) based on weighted UniFrac distance (Permanova, P < 0.01). Permutation test was used to test inter-individual similarity; Yellow box (winter vs winter, WW); green box (spring vs spring, SS); (c) based on unweighted UniFrac distance (WW vs SS, permutations = 999, P < 0.001); (d) based on weighted UniFrac distance (WW vs SS, permutations = 999, P < 0.0001).

