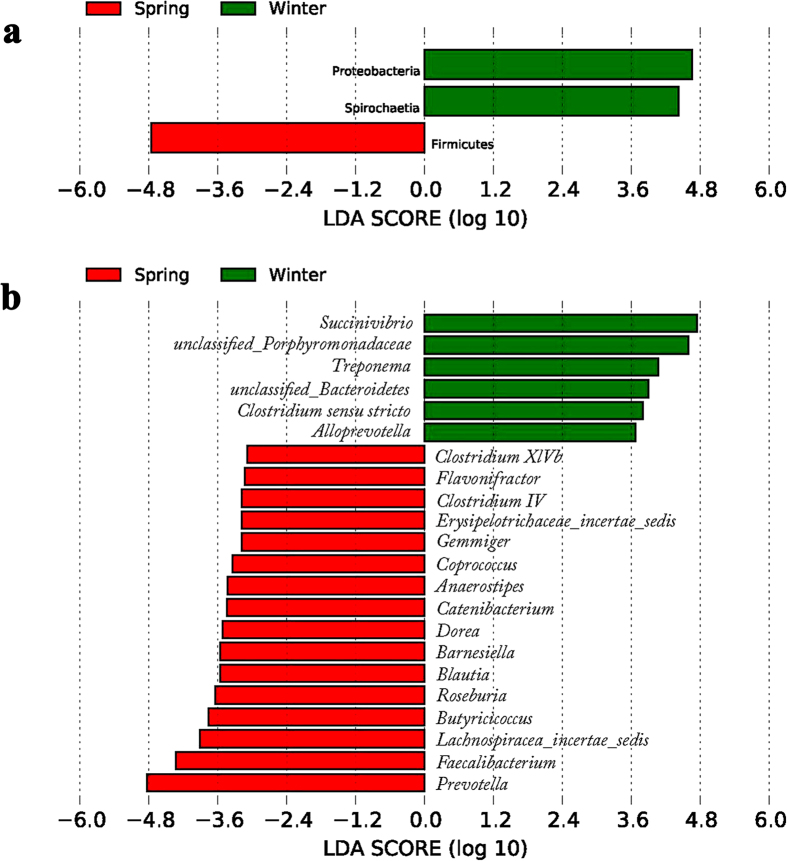
Figure 3. Phylum and genus differentially represented between winter and spring samples identified by linear discriminant analysis coupled with effect size (LEfSe) (LDA > 2, P < 0.05).
Red box: enriched in spring samples, green box: enriched in winter samples. (a) based on the relative abundance of phylum; (b) based on the relative abundance of genus.

