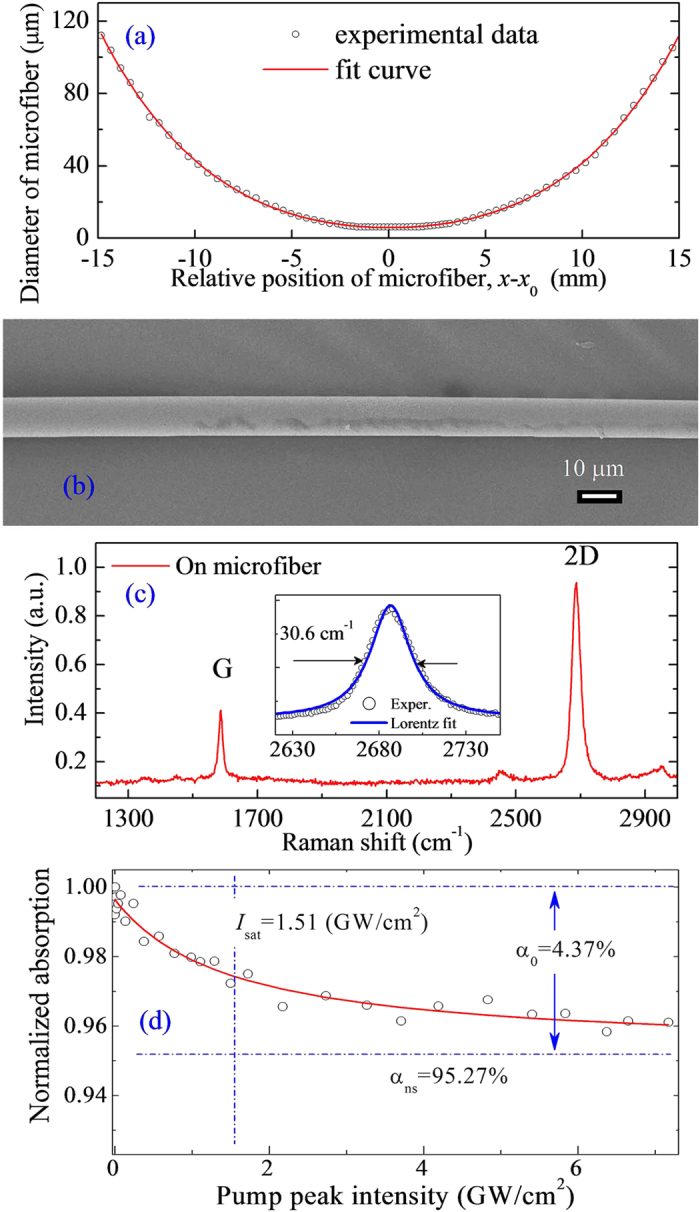
Figure 4. Sample characterization.

(a) Diameter of the microfibre along the direction of propagation. x0 is the position of the microfibre at the minimum diameter. (b) SEM image of the GCM. Scale bar, 10 μm. (c) Raman spectra of the monolayer graphene film on the microfibre. (d) Nonlinear absorption characterization of the GCM SA. The solid curve represents a fit to the experimental data (circles).
