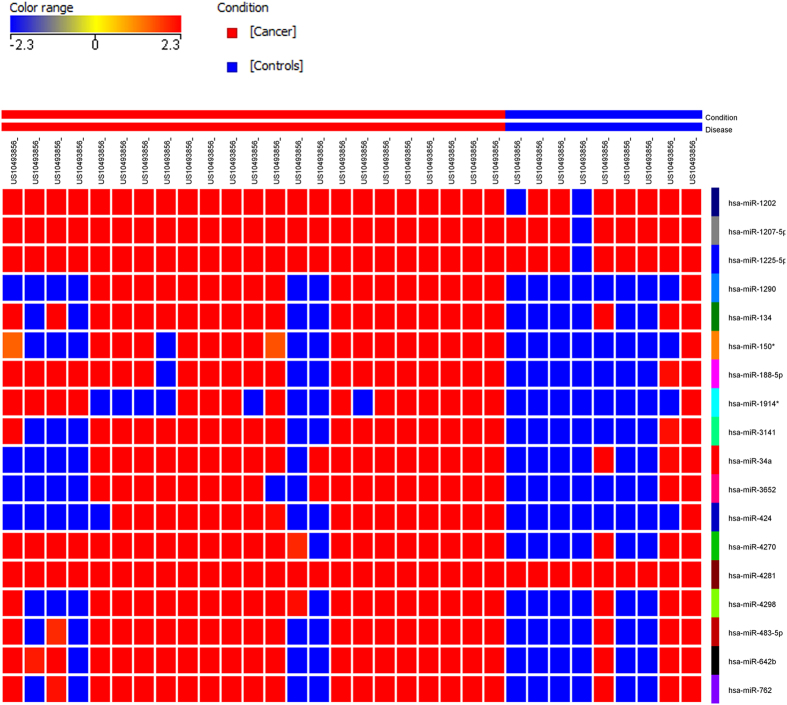
Figure 1. Heatmap depicting the expression of 18 circulating miRNAs in patients with breast cancer (BC) compared to normal healthy controls.
Heatmap of individual plasma samples of 9 control and 23 patients with BC. The miRNA expression levels exhibited ≥2.0 fold changes and p ≤ 0.05 are presented. Each column represents an individual sample and each row represents a single miRNA. Expression level of each miRNA in a single sample is depicted according to the color scale.

