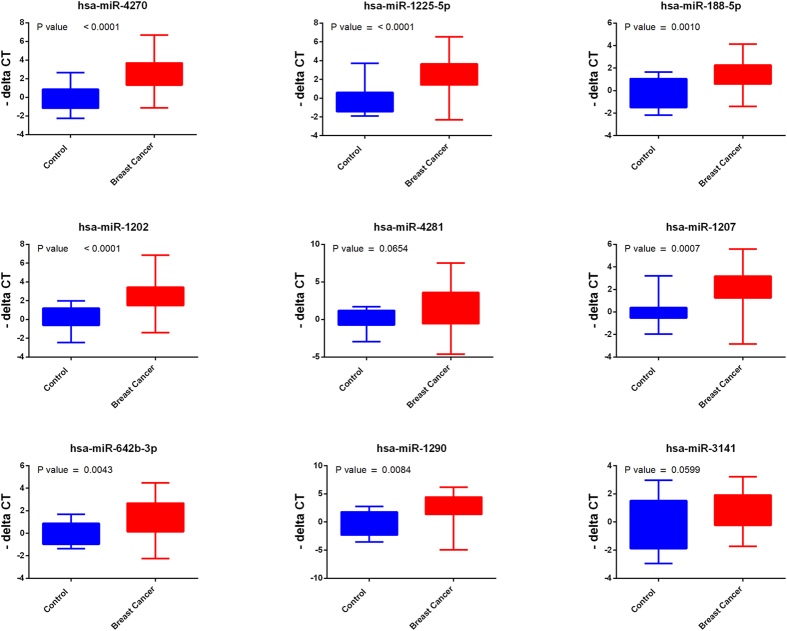
Figure 2. Validation of the expression of 9 miRNAs identified from microarray data employing plasma or serum from patients with breast cancer (BC, n = 46) and healthy controls (n = 14) using quantitative Real-Time PCR.
P values were calculated using unpaired t-test and are indicated on each plot. Data are presented as “−delta CT” using box and whiskers plots.

