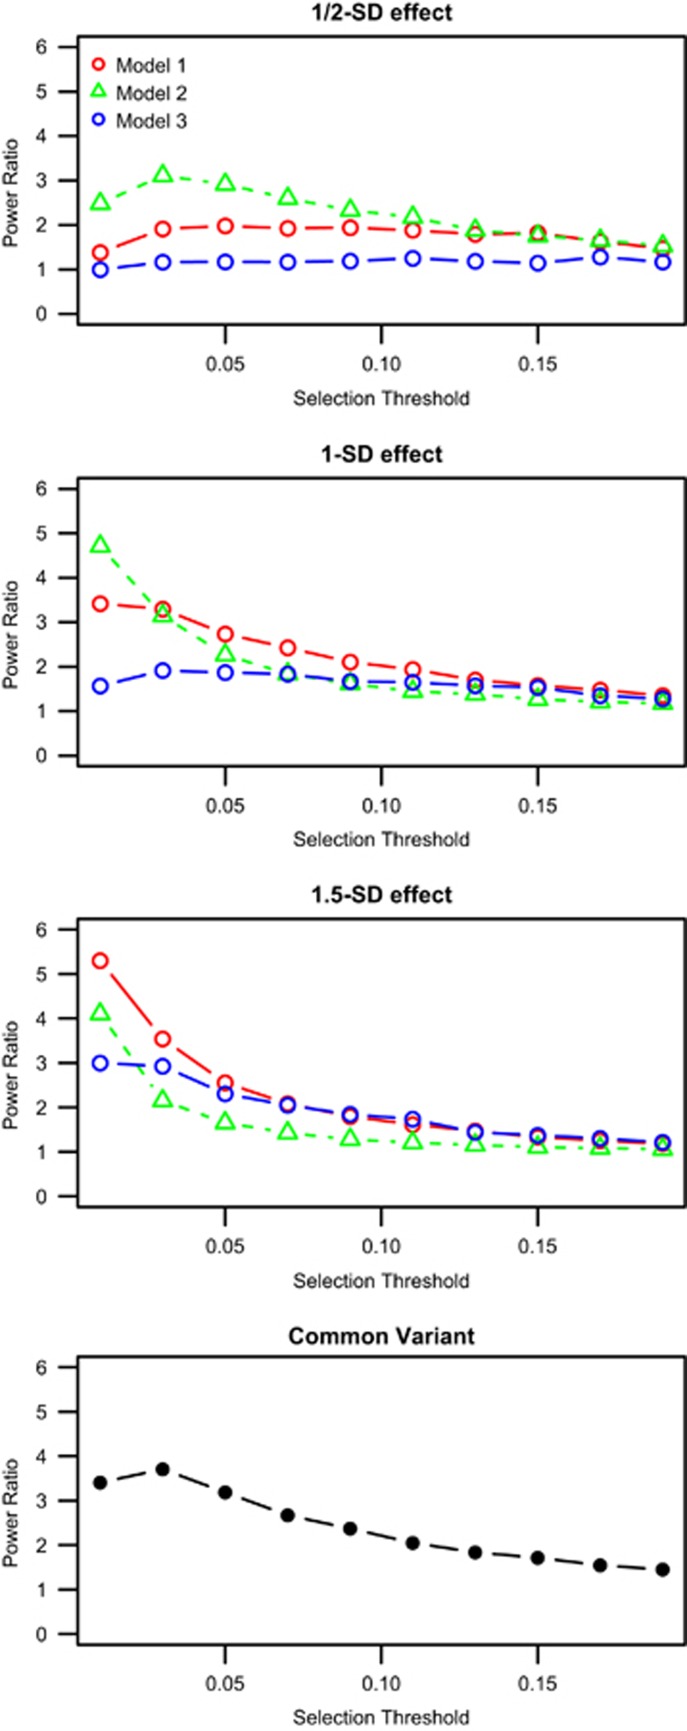
Figure 1.
Ratios of power from the fixed sample size simulation. Samples were simulated with equal numbers for the population-based random sample (RS) and the extreme case–control (CC) sample. The x axis is Threshold, the threshold for selecting the extreme samples. The y axis is the Power Ratio, the ratio of the CC power over the RS power. The first three plots are for the rare variant tests with three different models. The last panel is the power difference for the common variant. The probability that specific class of mutations are function was simulated as follows: Model 1 – prob=0.3, poss=0.05, benign=0.1; model 2 – prob=0.5, poss=0.2, benign=0.05 (increases the amount of variation that is functional); model 3 – prob=0.1, poss=0.01, benign=0.001 (decreases the amount of variation that is functional).

