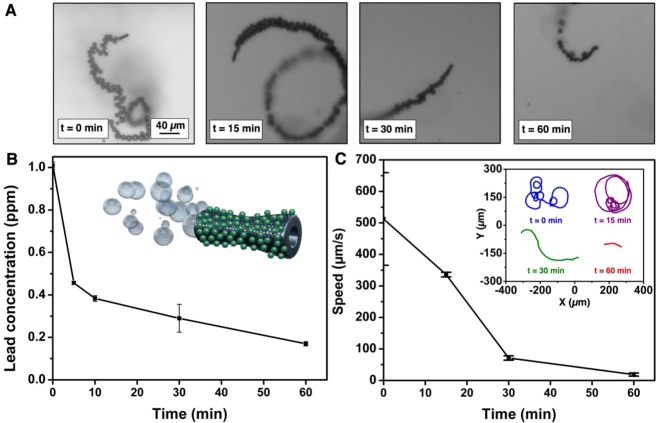
Figure 3.
Kinetics of Pb(II) decontamination and speed for the GOx-microbots. (A) Optical snapshots from videos of GOx-microbots moving at different times during the decontamination process. (B) Pb(II) ion concentration at different time intervals during decontamination by GOx-microbots (inset: illustration of a GOx-microbot with adsorbed lead (green dots) on the surface after the decontamination process). (C) Speed of GOx-microbots at different times (0, 15, 30, and 60 min, inset: trajectories of the GOx-microbots for 5 s). Experimental conditions: 1 ppm as initial Pb(II) concentration, 1.5% (v/v) of H2O2 and 0.1% (w/v) SDS.

