
Figure 1.
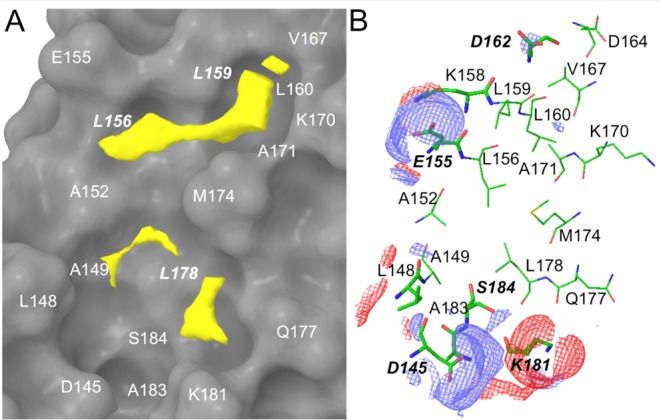
SiteMap results at the β-catenin/BCL9 PPI interface (PDB id, 2GL727). (A) Hydrophobic map. β-Catenin is shown as a surface model. The threshold for the hydrophobic contour in yellow was set to −0.5 kcal/mol. A stick model for the hydrophobic SiteMap is shown in Supporting Information Figure S1. (B) H-bond map. The threshold for the H-bond donor (red) and acceptor (blue) contours was set to −8 kcal/mol. The β-catenin residues are colored green.