
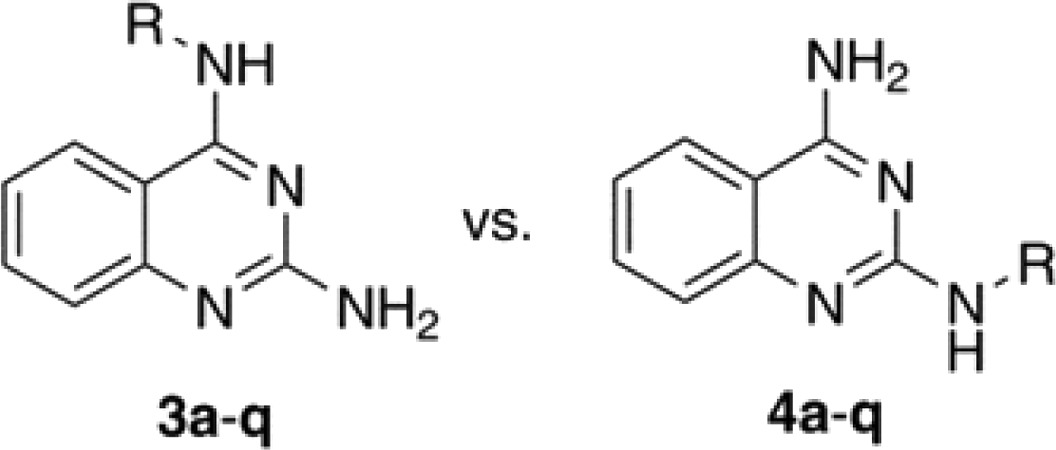
Table 1. Inhibition Data for DAQ Isomeric Derivatives 3a–q and 4a–q against Self-Induced Aβ40 and Aβ42 Aggregation.
| IC50 (μM)a,b |
IC50 (μM)a,b |
|||||
|---|---|---|---|---|---|---|
| N4-isomer | Aβ40 | Aβ42 | R-group | Aβ40 | Aβ42 | N2-isomer |
| 3a | 4.8 | >25 | benzyl | 2.2 | 8.4 | 4a |
| 3b | 3.6 | >25 | 3-Me-benzyl | >25 | >25 | 4b |
| 3c | 3.9 | >25 | 4-Me-benzyl | 13.1 | 22.5 | 4c |
| 3d | 20.6 | n.a | 3-OMe-benzyl | >25 | >25 | 4d |
| 3e | 1.1 | >25 | 4-OMe-benzyl | 6.8 | >25 | 4e |
| 3f | 3.5 | 21.0 | 3-CF3-benzyl | 12.5 | 13.8 | 4f |
| 3g | 1.9 | >25 | 4-CF3-benzyl | 2.3 | 5.3 | 4g |
| 3h | 1.9 | >25 | 3-Cl-benzyl | 5.9 | 13.4 | 4h |
| 3i | 0.62 | >25 | 4-Cl-benzyl | 0.93 | 8.1 | 4i |
| 3j | 0.58 | 22.3 | 3-Br-benzyl | 1.5 | 2.7 | 4j |
| 3k | 0.08 | 14.8 | 4-Br-benzyl | 1.7 | 1.7 | 4k |
| 3l | 2.8 | >25 | 3-F-benzyl | 11.3 | 14.7 | 4l |
| 3m | 3.1 | >25 | 4-F-benzyl | >25 | >25 | 4m |
| 3n | 7.8 | >25 | phenethyl | 14.9 | >25 | 4n |
| 3o | 14.9 | n.a | n-Pr | >25 | >25 | 4o |
| 3p | 10.2 | n.a | i-Pr | >25 | >25 | 4p |
| 3q | 13.6 | >25 | cyclohexylmethyl | >25 | >25 | 4q |
| DAQ | P.A | P.A | 1.5 | 3.1 | curcumin | |
| orange G | 3.0 | 8.7 | 2.6 | 4.1 | resveratrol | |
a
IC50 values are calculated based on the ThT-based fluorescence spectroscopy assay (excitation = 440 nm, emission = 490 nm).
b
Values are mean values of triplicate readings for three independent experiments. n.a = not active. P.A = promotes aggregation.