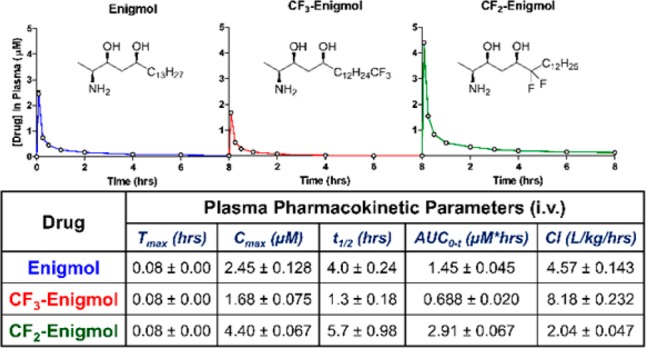
Figure 2.

Plasma pharmacokinetics (i.v.). SD rats (n = 3–4 per group) were treated with compound (2 mg/kg) via i.v. injection (vehicle =40:10:3:47 PEG400/EtOH/Tween80/H2O), and plasma concentration was measured periodically using LC-MS/MS. Data represent the mean ± SEM.
