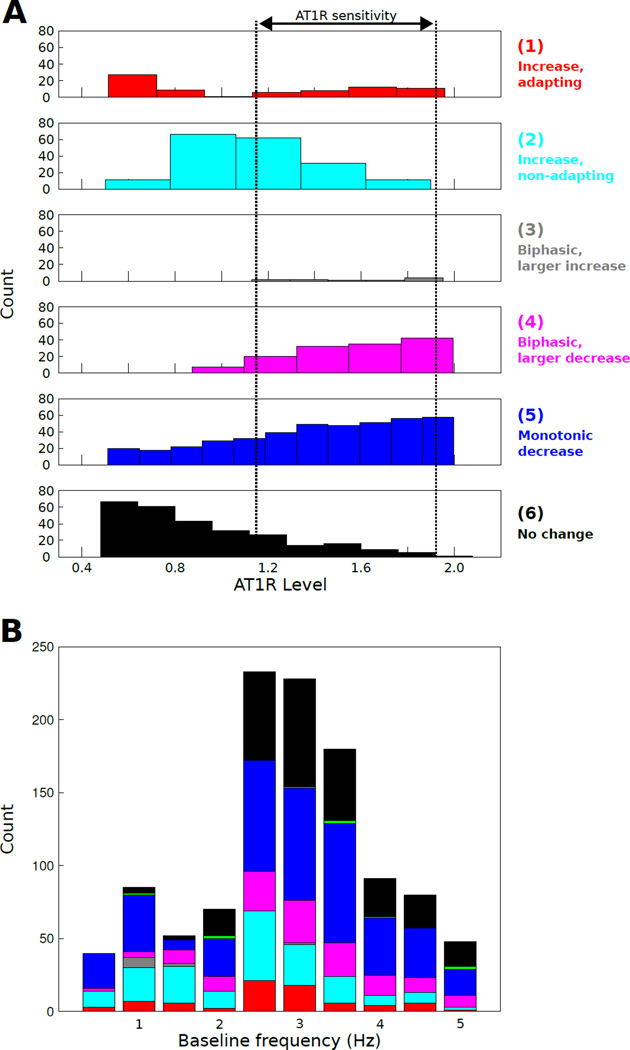
Fig. 5. Unbiased sampling supports forward engineering results.
(A) The AT1R histogram replicates phenotype-specific AT1R distributions with a region of neuromodulation response sensitivity to biophysical state. (B) Neuromodulation response phenotype distributions as a function of baseline firing rate.

