Figure 2.

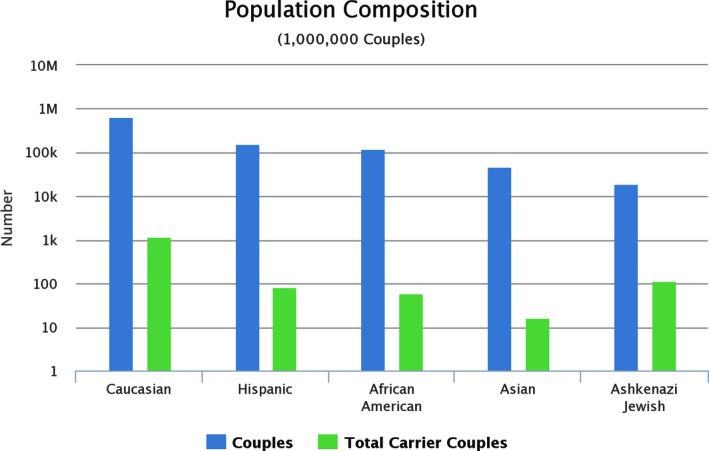
Projected composition of carrier status by ethnicity (simulated data), all disorders considered. Note the logarithmic y‐axis which shows orders of magnitude difference between number of couples and carrier couples.

Projected composition of carrier status by ethnicity (simulated data), all disorders considered. Note the logarithmic y‐axis which shows orders of magnitude difference between number of couples and carrier couples.