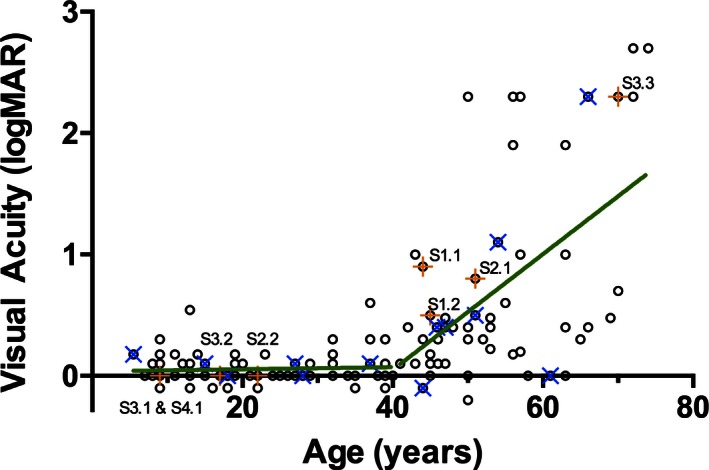
Figure 4.

The best‐corrected visual acuity (logMAR equivalent) of affected males' better eye as a function of age (n = 128). The sample population is divided at the critical age (40 years old) into the ≤40 years old group or the >40 years old group. Individuals with missense mutations are indicated by an orange + and labeled; individuals who do not express any Rab escort protein 1 due to whole gene deletions or deletions of the ATG start codon are indicated by a blue ×. The rate of change of visual acuity predicted by a linear regression model (green line) in the ≤40 years old group is not significantly different from 0 (P = 0.71); the rate of change of visual acuity in the >40 years old group is 0.0483 logMAR units/year (P = 0.001).
