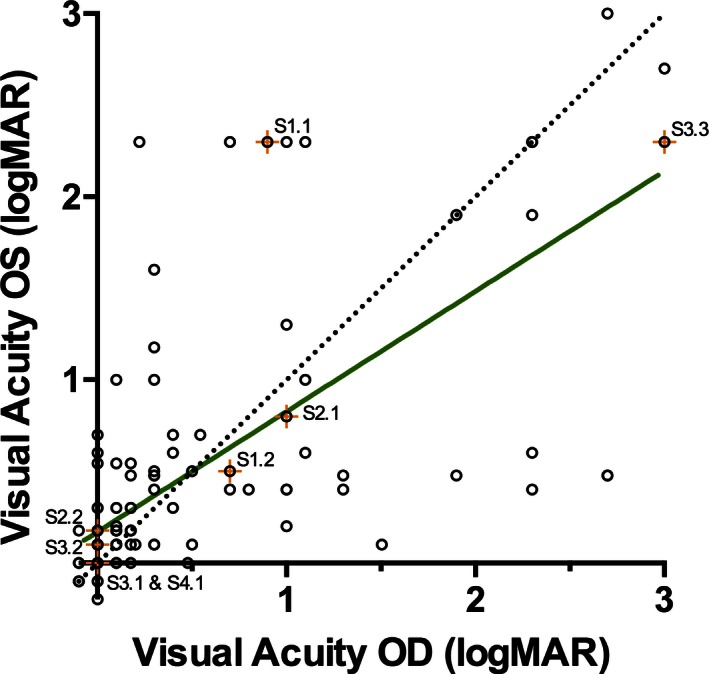
Figure 5.

The intereye correlation of the best‐corrected visual acuities (logMAR) of affected males. A perfect correlation is also plotted for comparison (dotted line). The visual acuities of individuals' eyes are highly correlated (Spearman r = 0.76). Subjects with missense mutations are indicated by an orange + and labeled. OS, left eye; OD, right eye
