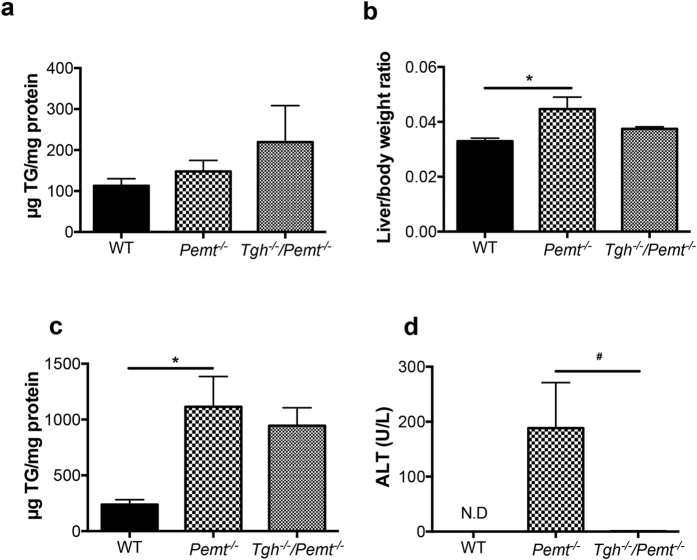
Figure 4. Hepatic metabolic parameters in Pemt−/− and Tgh−/−/Pemt−/− mice fed chow and 1 week HFD.
(a) Liver TG mass in WT, Pemt−/− and Tgh−/−/Pemt−/− mice fed chow. (b) Liver/ body weight ratio in WT, Pemt−/− and Tgh−/−/Pemt−/− mice after 1 week HFD. (c) Liver TG mass in WT, Pemt−/− and Tgh−/−/Pemt−/− mice after 1 week HFD. (d) Plasma ALT in WT, Pemt−/− and Tgh−/−/Pemt−/− mice after 1 week HFD. n = 5,6. Data are mean ± SEM. *P < 0.05 vs WT control, #P < 0.05 vs Pemt−/− mice.

