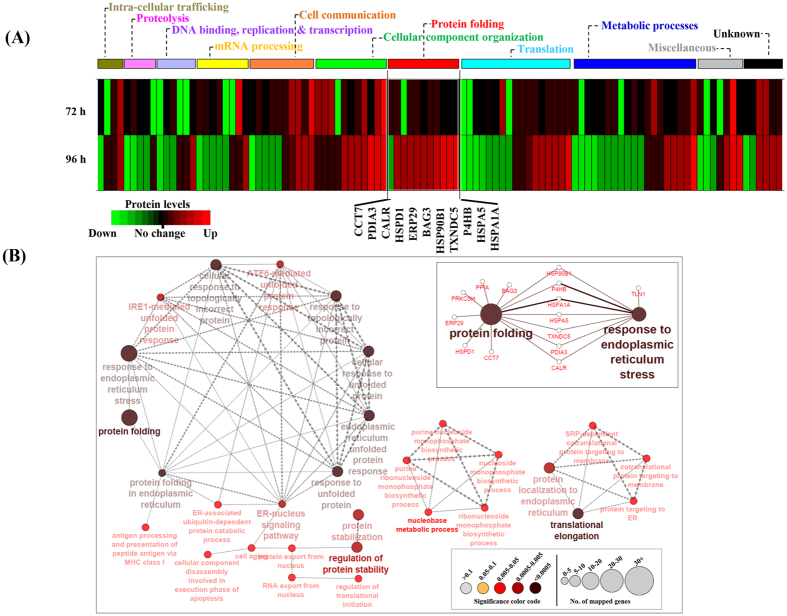
Figure 4. Functional ontology analyses of proteins with significantly altered levels upon depletion of eIF5A.
(A) The heat map of 104 differentially expressed proteins identified from iTRAQ analyses at two time points (72 and 96 h of adenoviral transduction). The decreased and increased proteins are indicated by range of green and red intensities, respectively. Different functional categories of proteins are indicated with horizontal bars on top. The 11 proteins belonging to the ‘protein folding’ category are indicated under the heat map. (B) Three major functional networks obtained from the 104 proteins using Cytoscape software. Each node (filled circle) represents a biological process and the size and color code indicate, respectively, the number of genes and significance of the terms (bottom inset). The direction of network is shown by arrow-head of edges and the edge-thickness is based on kappa-score level calculated automatically by ClueGO. The molecular interaction network between protein folding and response to ER stress is shown in the inset.

