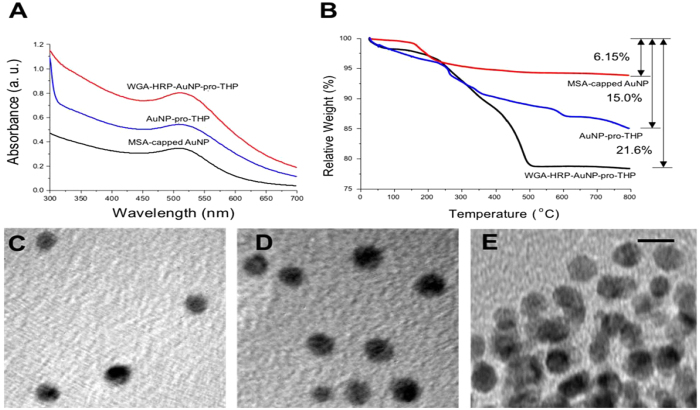
Figure 2. Characterization of transporter protein and drug-conjugated AuNPs.
(A) UV-vis spectra of MSA-capped AuNP, AuNP-pro-THP, and WGA-HRP-AuNP-pro-THP in deionized water (pH = 5.8) at room temperature. The spectra are shifted along the vertical axis for easy comparison. (B) TGA data of weight loss for MSA-AuNPs of 6.15% (AuNP : MSA = 100 : 6.6), AuNP-pro-THP of 15.0% (AuNP : MSA : pro-THP = 100 : 6.6 : 11.1) and WGA-HRP-AuNP-pro-THP of 21.6% (AuNP : MSA : pro-THP : WGA-HRP = 100 : 6.6 : 11.1 : 11.5). (C) TEM image of MSA-capped AuNP. (D) TEM image of AuNP-pro-THP. (E) TEM image of WGA-HRP-AuNP-pro-THP. The scale bar for all TEM images is 5 nm.

