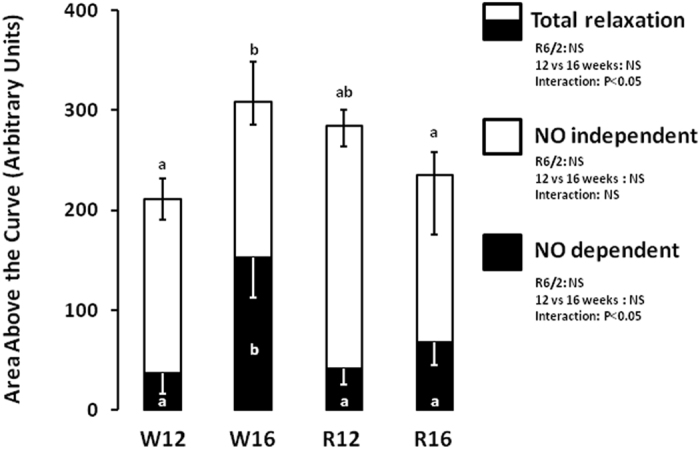
Figure 2. Relative contributions to endothelial dependent relaxation in the R6/2 mouse.

The data show the area above the relaxation curve in response to methacholine. The total bar represents total vasodilator capacity. NO independent relaxation is the area above the curve in the presence of the NOS inhibitor L-NAME and NO dependent is the difference between total vasodilator capacity and NO independent relaxation. Experiments performed in femoral arteries of 12 week old WT (W12, n = 8), 12 week old R6/2 (R12, n = 6), 16 week old WT (W16, n = 8) and 16 week old R6/2 (R16, n = 5) mice. Different letters, a and b, represent significantly different responses between groups, P < 0.05. Two-way ANOVA with post-hoc Bonferroni Test.
