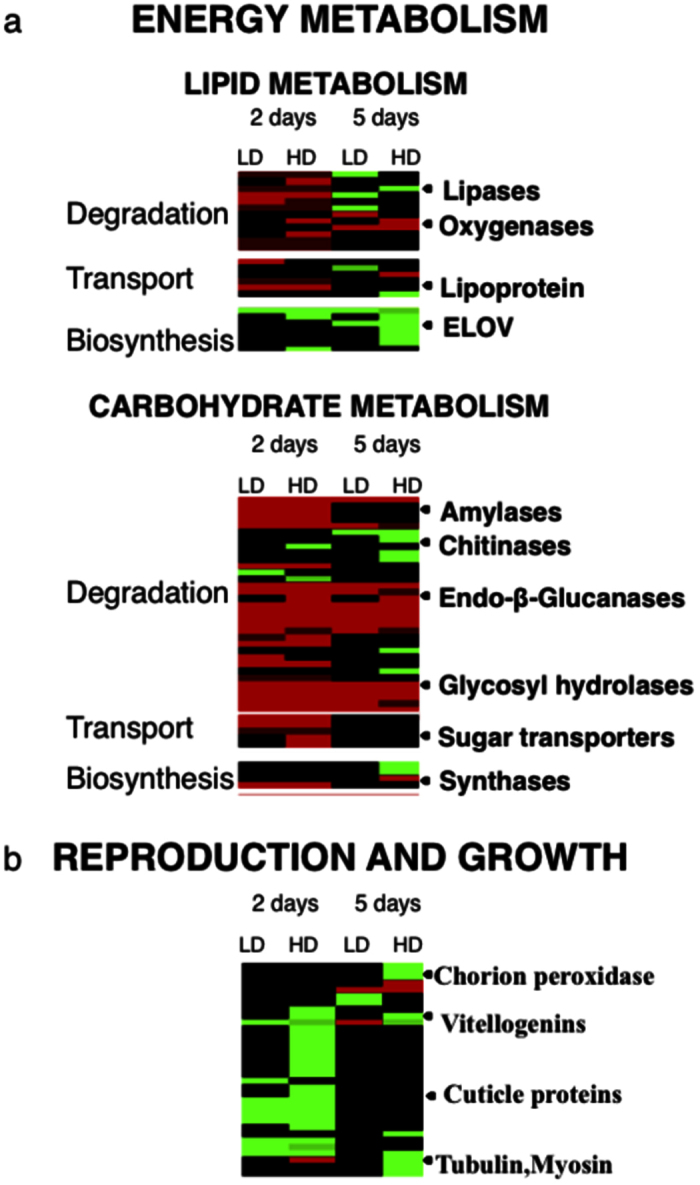
Figure 4. Differential expression for energy metabolism and growth related genes.

(A) Heat map for DEGs in C. finmarchicus adult females feeding on A. fundyense diets (LD, HD) for either 2 or 5 days involved in energy metabolism that included lipid and carbohydrate metabolisms; genes were clustered by functional annotation in the groups: degradation, transport and biosynthesis (labels on the left). (B) Heat map for DEGs in C. finmarchicus adult females feeding on A. fundyense diets (LD, HD) for either 2 or 5 days involved in reproduction and growth. Heat maps were generated using the heatmap.2 function implemented in R software. Columns are ordered by time points (2 and 5 days) and by treatment (LD and HD) as labeled. Relative expression rate (absolute fold change) is calculated for females feeding on the toxic diet compared to adult females.
