
Figure 1. vMIA localizes at peroxisomes and causes their fragmentation.
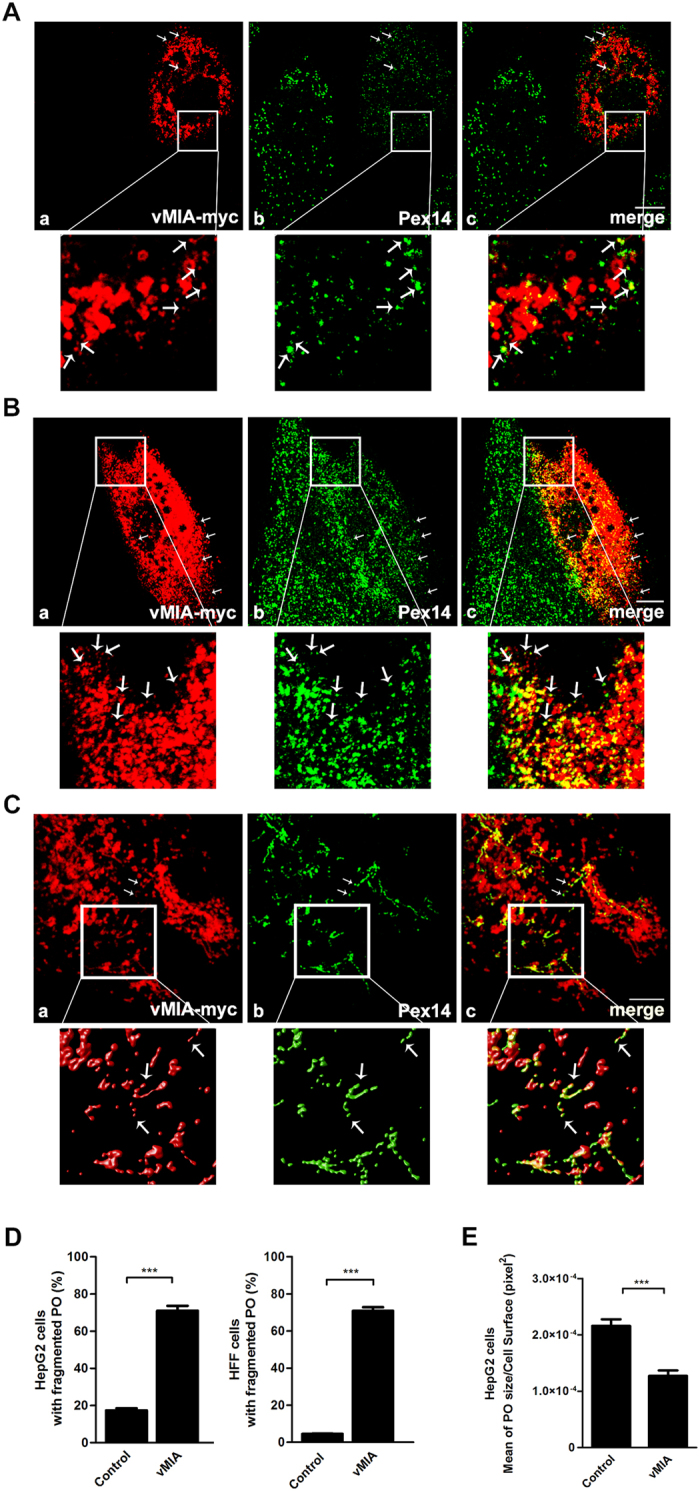
(A) (a-c) vMIA intracellular localization in HepG2 cells (a) vMIA-myc, (b) Pex14 and (c) merge image of a and b. (B) (a-c) vMIA intracellular localization in HFF cells (a) vMIA-myc, (b) Pex14 and (c) merge image of a and b. (C) (a-c) vMIA intracellular localization in DLP1-patient cells. (a) vMIA-myc, (b) Pex14 and (c) merge image of a and b. The images presented in the zoom insets from panel (C) are the result of deconvolution and 3D rendering analysis. Confocal images from immunofluorescence staining. Bars represent 10 μm. Arrows represent co-localization loci. (D) Quantification analysis of peroxisome morphology in the presence and absence of vMIA in HepG2 and HFF cells. We considered cells containing “fragmented peroxisomes” as those whose peroxisomes were significantly smaller and in higher number when compared to the control cells. Data represents the means ± SEM of three independent experiments. Error bars represent SEM. ***p < 0.001 in a Student’s t test. (E) Quantification analysis of peroxisomal area (pixel2) in the presence or absence of vMIA in HepG2 cells, using the Spot Detector plug-in from Icy Bioimage Analysis Software. Data represents the means ± SEM of three independent experiments. Error bars represent SEM. ***p < 0.001 in a Student’s t test.