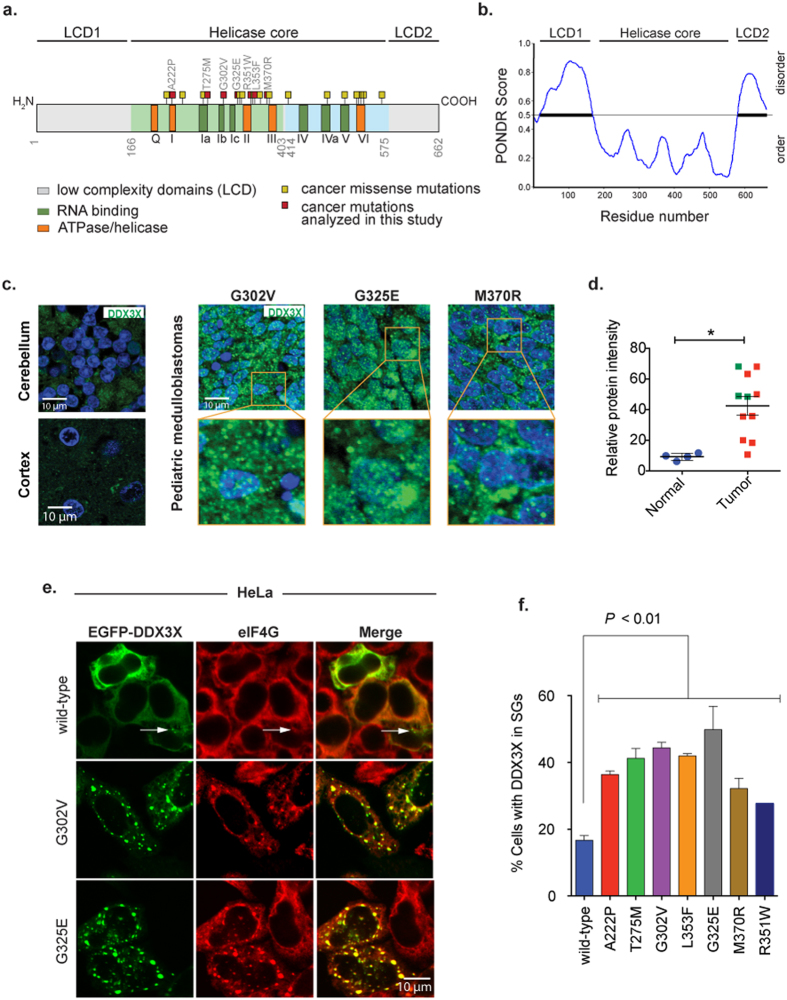
Figure 1. MB-associated mutations in DDX3X drive the assembly of stress granules.
(a) Schematic representation of DDX3X missense mutation occurring in pediatric MB. Shown is the structural organization of DDX3X protein (ATPase/helicase and RNA binding functional motifs are denoted in orange and dark green boxes; N- and C-terminal low complexity domains are denoted in light gray). MB-associated mutation positions (yellow and red boxes) are based on three genomic studies11,12,13. Cancer mutations analyzed in this study are denoted in the diagram (red boxes). (b) Low complexity domains (LCD1 and LCD2) of DDX3X are predicted to be disordered. Scores above 0.5 indicate predicted disorder by the meta-predictor PONDR-FIT62. (c) Photomicrographs of DDX3X immunofluorescence in three pediatric MBs carrying mutations in DDX3X and normal brain (cerebellum and cortex). Green and blue colors represent DDX3X and DAPI staining, respectively. Boxes denote magnified area shown at the bottom of the indicated sample. (d) Quantification of protein levels in MB tumors and normal brain. Green squares represent tumors carrying mutations in DDX3X (panel c), while red represent tumors carrying the wild-type form. Mean ± SEM is shown. **P = 0.0068, Student’s t-test comparison between normal brain tissues and MB tumors. (e) Co-localization of the indicated EGFP-tagged DDX3X with the SG marker eIF4G in HeLa cells under normal culture conditions. EGFP-tagged DDX3X plasmids were transfected in HeLa cells for 24 h followed by immunofluorescence against the SG marker eIF4G (red). (f) Quantification of SGs in HeLa cells transfected with wild-type and MB-associated mutant DDX3X forms for 24 h under normal conditions. Mean ± SEM values are based on a minimum of three replicated experiments. Student’s t-test comparison between wild-type DDX3X and each MB-associated mutants is shown.

