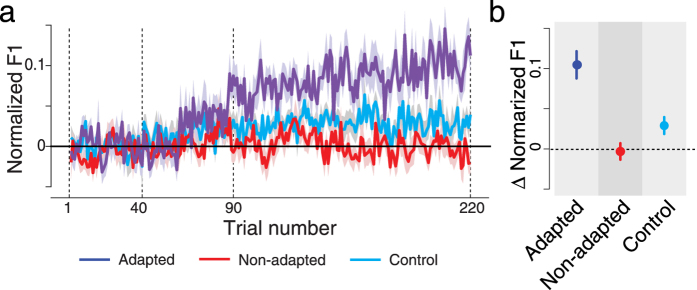
Figure 2.
(a) Normalized first formant frequency over the course of training with altered auditory feedback. The shaded area represents one standard error across participants. The vertical dotted lines show the start (40) and end (90) of the ramp phase of the F1 shift. The dotted lines at 1 and 220 show the beginning and end of training. We aligned the behavioral data using the average F1 frequency between trials 21–40, which is the baseline level before the beginning of altered auditory feedback. (b) Average amplitude of first formant change due to speech motor training. Error bars represent one standard error across participants. The vertical axes in both panels represent normalized F1 values relative to baseline productions of F1.

