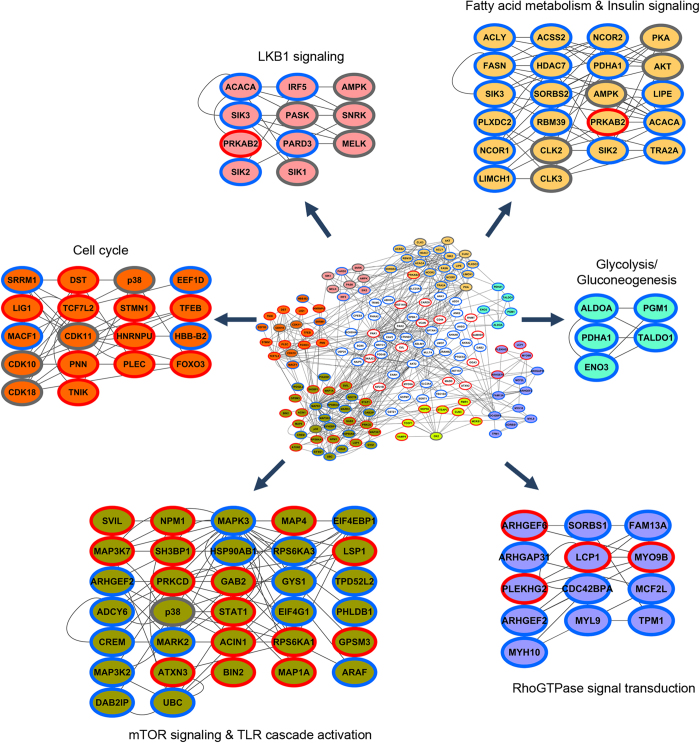
Figure 3. Protein-protein interaction network among altered phosphoproteins.
The integrated functional network built from phosphoproteins regulated upon HFD-induced obesity in WAT. The densely connected sub-networks extracted using ClusterONE from the total network are shown in different colors. Nodes with red and blue borders correspond to upregulated and downregulated phosphoproteins, respectively. Gray border correspond to kinases mapped based on interactions from kinase-substrate prediction analysis.

