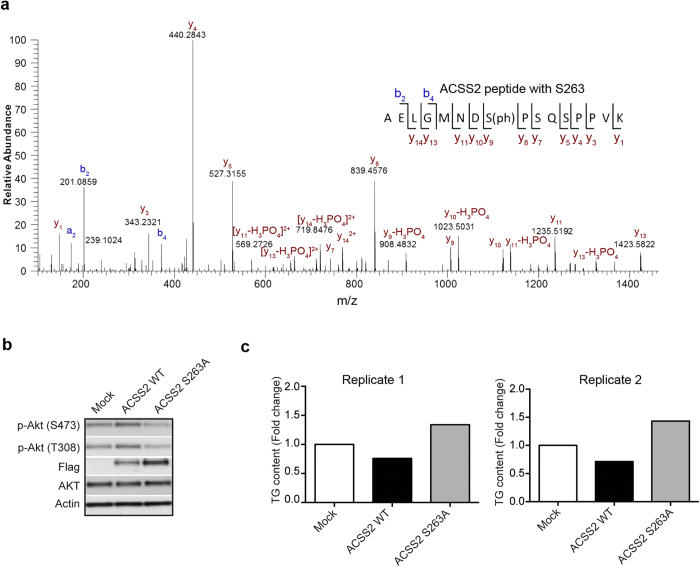
Figure 5. HFD altered ACSS2 phosphorylation affects insulin signaling and triglyceride level.
(a) MS/MS spectra validating the phosphorylation of ACSS2 at serine 263 (b) WT ACSS2 and mutant ACSS2 S263A were expressed in 3T3-L1 adipocytes and treated with 1 μM Dex followed by insulin stimulation. Western blot analysis of insulin resistance measured using pAKT (S473) and pAKT (S308). Flag indicates expression levels of WT ACSS2 and ACSS2 S263A mutant. Actin served as loading control (n = 2 biological replicates). (c) Fold increase in triglyceride level in 3T3-L1 adipocytes overexpressing WT ACSS2 and mutant ACSS2 S263A upon Dex treatment (n = 2 biological replicates).

