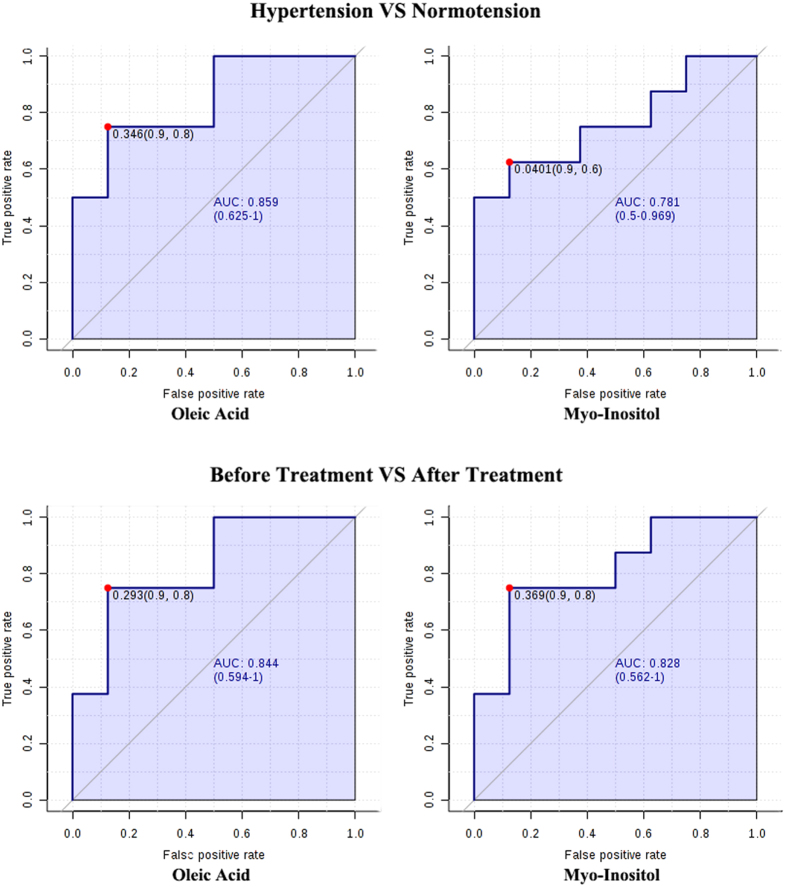
Figure 2. Receiver operating curve analysis for OA and MI.
In the comparison between hypertension group and control group, the area under the curve (AUC) of OA and MI is 0.859 (0.625–1) and 0.781 (0.5–0.969), respectively. The AUC of OA and MI is 0.844 (0.594–1) and 0.828 (0.562–1) when comparing the pretreatment data with post-treatment data.

