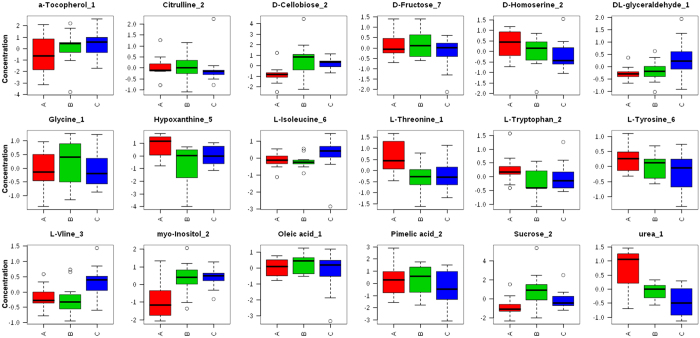
Figure 3. Normalized concentration for key metabolites in hypertension patients’ plasma and healthy subjects’ plasma.
Metabolite concentration for several targeted key metabolites were median-normalized and Log10-transormed. (A) Is abbreviated for ‘after treatment’, (B) is short for ‘before treatment’, and (C) for ‘control’.

