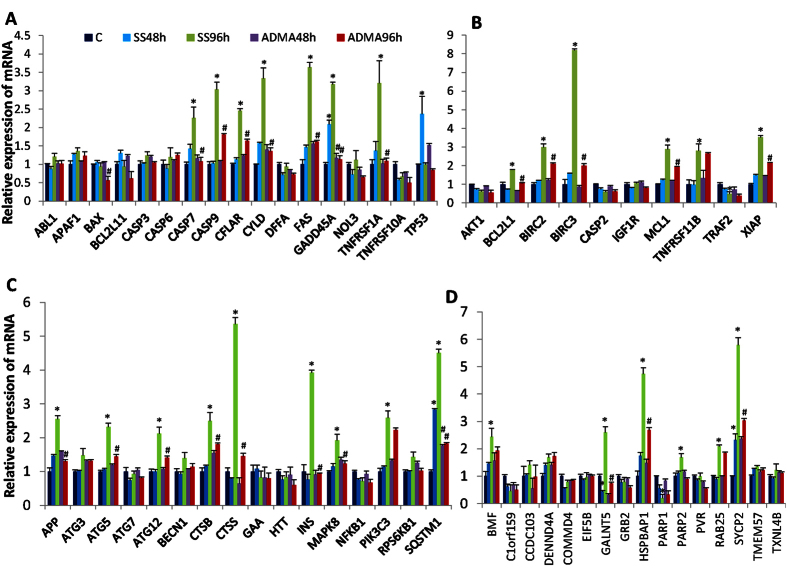
Figure 4. The expression analysis of genes involved in cell death pathways by using RT2 Profiler Array.
(A) Genes in pro-apoptosis pathway; (B) Genes in anti-apoptosis pathway; (C) Genes in autophagy pathway; (D) Genes in necrosis pathway; Data are means ± S.E.M. of triplicates at least for each group. *indicates P < 0.05 compared to control group, #P < 0.05 compared to the corresponding serum starvation group with Student’s t test.

