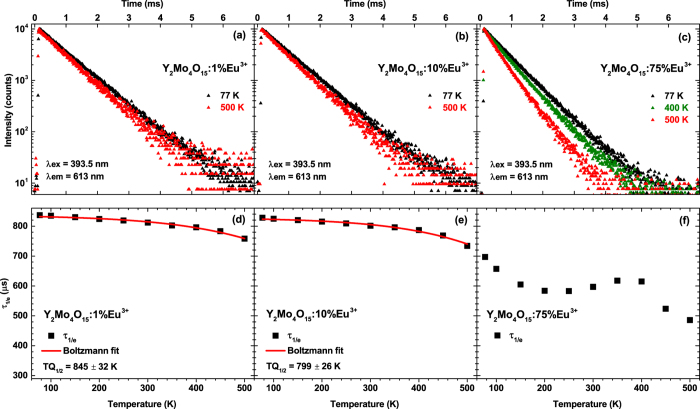
Figure 7. Temperature dependent photoluminescence decay curves and calculated decay constants.
Decay (λex = 393.5 nm, λem = 613 nm) curves of (a) Y2Mo4O15:1%Eu3+, (b) Y2Mo4O15:10%Eu3+, (c) Y2Mo4O15:75%Eu3+. Calculation of TQ1/2 values for the samples doped with (d) 1% Eu3+ and (e) 10% Eu3+. (f) Temperature dependent decay constants of 75% Eu3+ doped sample.

