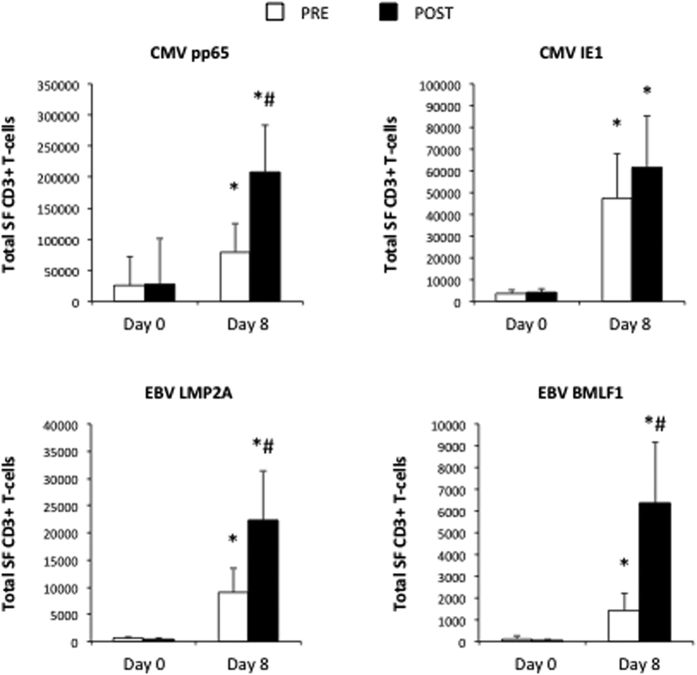
Figure 3. The effects of a single exercise bout on the frequency of viral-specific T-cells before and after 8 days of viral-peptide stimulation adjusted for total CD3+ T-cell numbers.
To account for differences in total CD3+ T-cell numbers among PBMCs and the expanded VSTs, the proportion of viral-specific cells among PBMCs (Day 0) and the expanded VST’s (Day 8) were multiplied by the total number of CD3+ T-cells present in PBMCs and the expanded VST’s, respectively. Values are mean ± SEM. Statistically significant difference from Day 0 indicated by (*p < 0.05). Statistically significant difference between the before (PRE) and after (POST) exercise conditions indicated by (#p < 0.05).

