Figure 3.

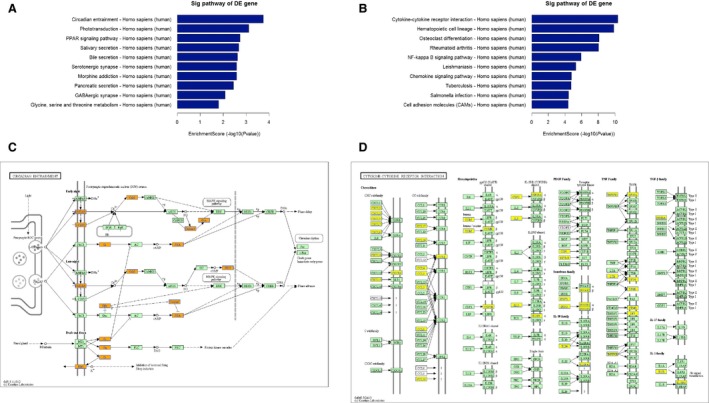
The top 10 enrichment scores in the pathway analysis of the up‐regulated (A) and down‐regulated (B) mRNAs. The lower panel shows the leading pathways associated with the up‐regulated (C) and down‐regulated (D) mRNAs.

The top 10 enrichment scores in the pathway analysis of the up‐regulated (A) and down‐regulated (B) mRNAs. The lower panel shows the leading pathways associated with the up‐regulated (C) and down‐regulated (D) mRNAs.