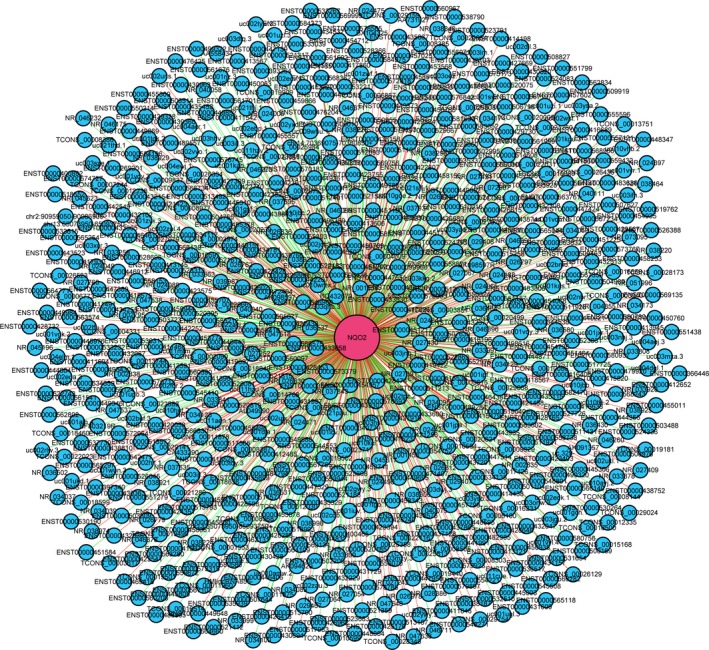
Figure 4.

Predictions of the coding‐noncoding gene co‐expression network. The co‐expression network was composed of one mRNA and 769 potentially associated lncRNAs. The 340 direct connections, indicated by the red solid line, are those in which the correlation between the mRNA and the potentially associated lncRNAs was positive. The 429 direct connections, indicated by the green solid line show the respective of negative correlations.
