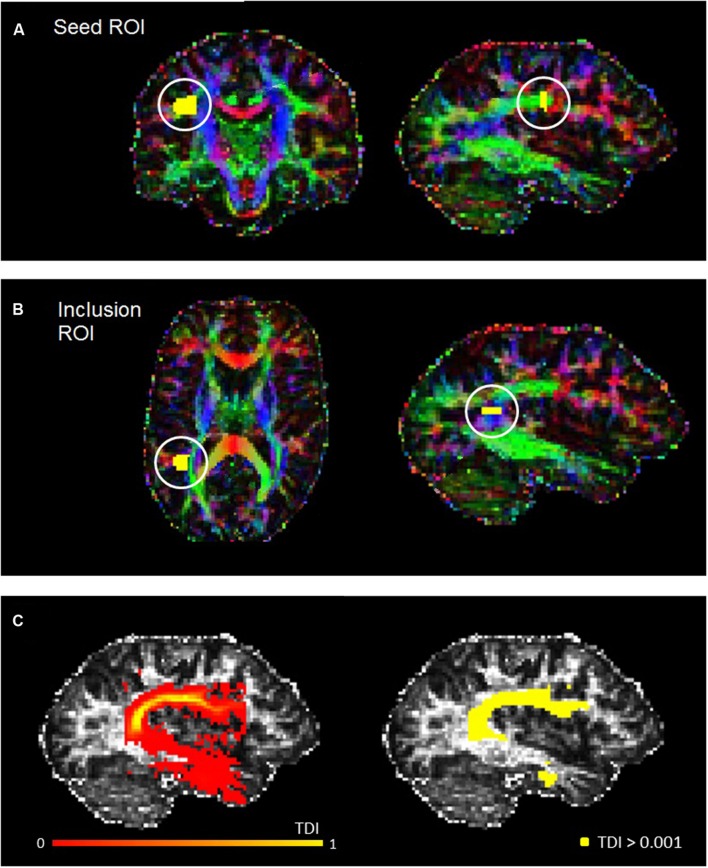
FIGURE 1.
Example seed (A) and inclusion (B) ROIs for a representative participant, defined in accordance with Liégeois et al. (2013). (C) Shows the track-density image for the left AF of the same participant (left), and also the thresholded AF mask used for the statistical analysis (right).

