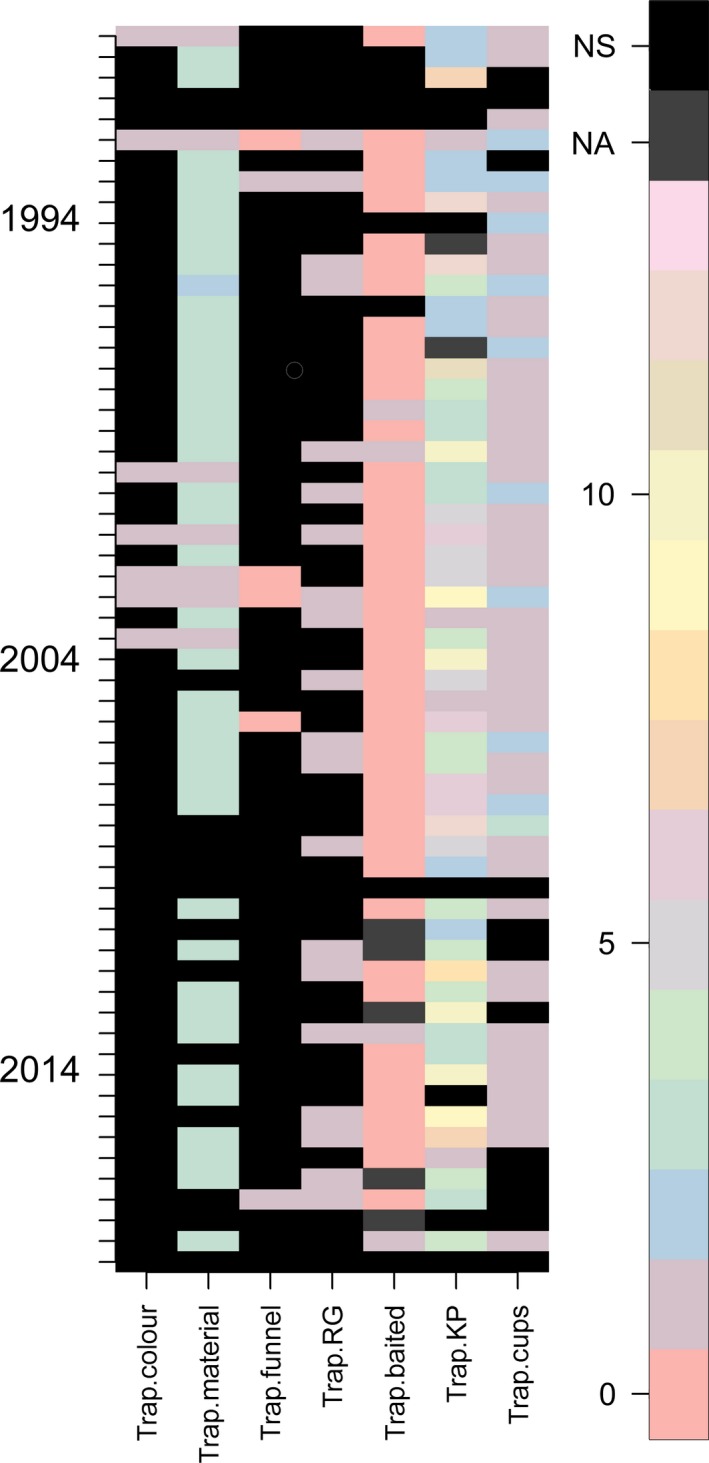
Figure 2.

A colorized matrix of pitfall trap design variables recorded from 60 research papers. Different colors represent different categories of value (e.g., different types of killing preservative). Each row represents a single study, while each column details the particular variable as reported in that study. “0” scores indicate where a particular feature was not used by the authors, while details that were not reported were coded as category 15 (black) and “Not Applicable” as category 14 (dark gray). The color of pitfall traps and the use of a funnel were less frequently reported than the other variables throughout the 20‐year period. The number of papers not reporting design features increased from 1994 to 2014 (138 “NS”, 157 “NS”, respectively). The variables trap.funnel, trap.RG, trap.baited, and trap.cups were scored as either “were present = 1”, “were absent = 2,” or “changed during study = 3”. The variable trap.KP (killing preservative) was scored 0–12, corresponding to different categories of major additive (e.g., ethanol, propylene glycol, formalin), with an additional category (13) when the preservative was changed during the study. The variable trap.material was scored as follows: glass = 1, metal = 2, plastic = 3. The key interpretation point for these figures is that if methodological variation was zero (and reporting complete) between researchers, the figure would be of a uniform color.
