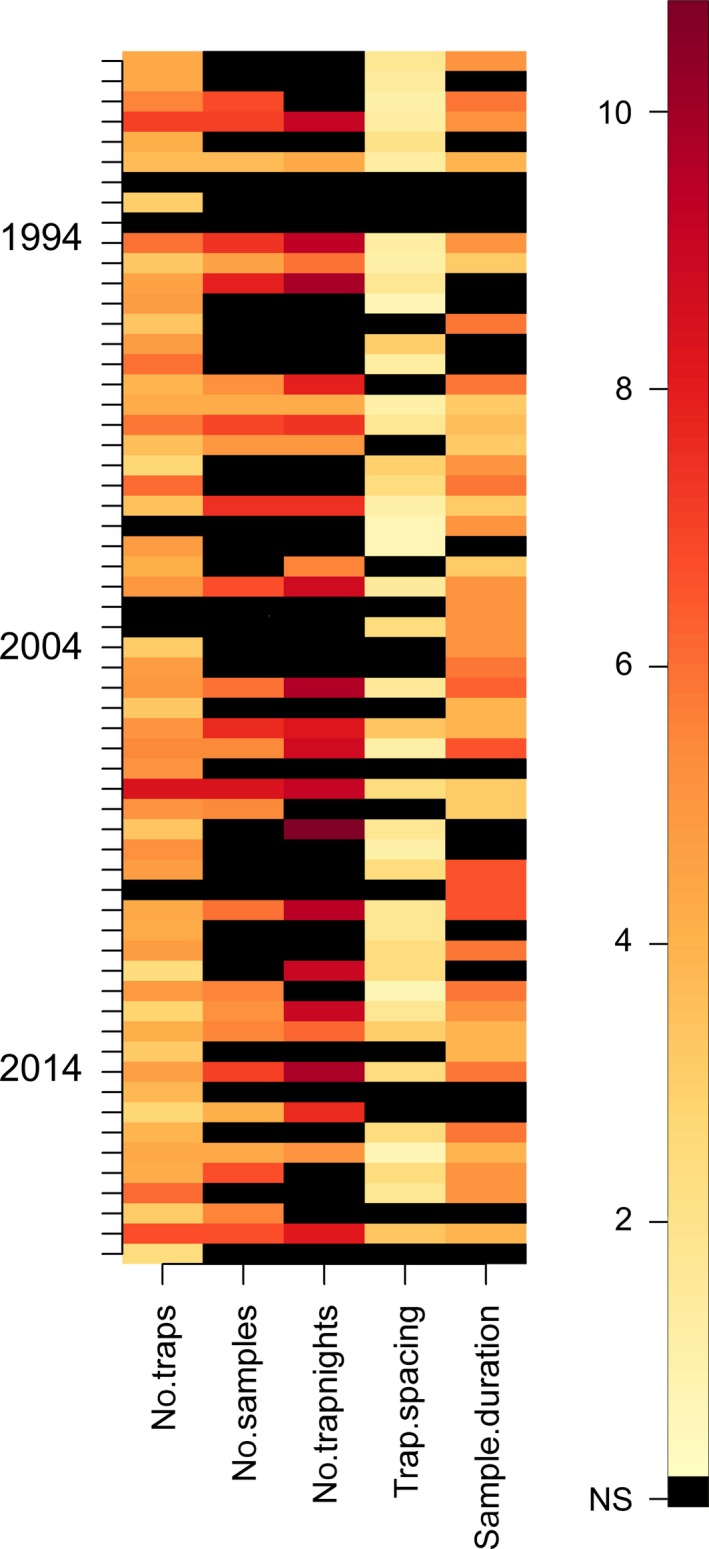
Figure 4.

A colorized matrix of the pitfall trap sampling variables recorded from the 60 research papers. “Not stated” and “Not applicable” values are shown in black (“NS”). Darker colored bars represent higher values. All values were transformed prior to plotting (loge + 1). While we make no recommendations regarding sampling design, it is worth noting that there was substantial variation in the number of traps used, the number of samples collected, and other factors such as the intertrap spacing and duration of individual sampling events. The key interpretation point for these figures is that if methodological variation was zero (and reporting complete) between researchers, the figure would be of a uniform color.
