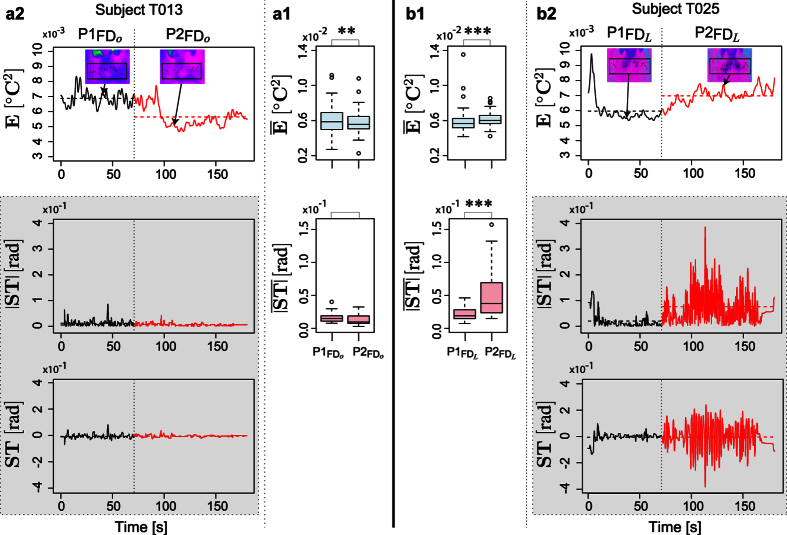
Figure 3. Statistics for Failure Drive’s first two phases.
Mean perinasal perspiration and absolute steering distributions for: (a1) The y = o group. (b1) The y = L group. § Failure Drive examples. Perinasal perspiration (E) and absolute steering/steering (|ST|/ST) signals for: (a2) Subject T013 belonging to the y = o group. The two insets depict thermal snapshots of perinasal perspiration in the initial ( ) and later (
 ) phase of the drive; the first pattern appears busier than the second. (b2) Subject T025 belonging to the y = L group. The two insets depict thermal snapshots of perinasal perspiration in the initial (
 ) and later (
 ) phase of the drive; the second pattern appears busier than the first. The dashed horizontal lines indicate the mean values in the corresponding signal segments.

