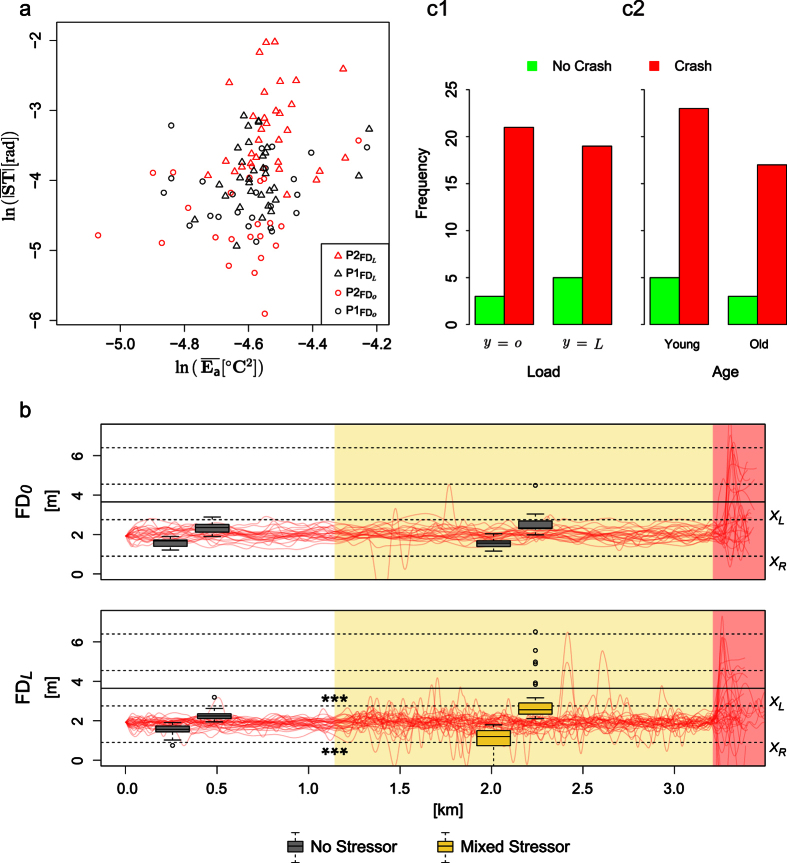
Figure 4.
(a) Scatterplot of mean absolute steering vs. mean perinasal perspiration for all subjects in the first two phases of FD. (b) Car itineraries for the y = o and y = L groups. White, yellow, and pink pavement indicate phase  ,
,  , and
, and  , respectively. Lane departures in
  , where the mixed stressor applied, are striking, suggesting an increased risk of accident. Extreme lane departures in
  are the results of the startling incidence - almost all cars crashed. Crash - No Crash incidents following the unintended acceleration event in phase
  according to: (c1) Load. (c2) Age.

