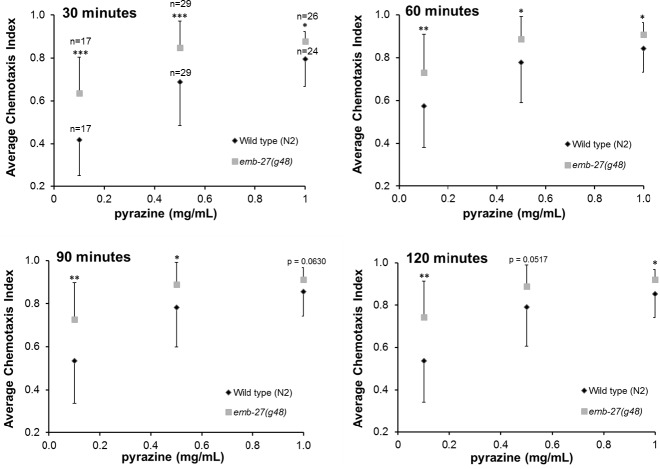
Figure 3. emb-27(g48) APC6 loss of function mutants show increased chemotaxis to pyrazine across multiple timepoints and concentrations.
Wild type and emb-27(g48) mutant animals were placed, following a 20 h temperature shift at the L4 stage, onto chemotaxis plates with 0.1 mg/mL, 0.5 mg/mL or 1 mg/mL pyrazine as the attractant and ethanol as the counterattractant. Every 30 min for 2 h, the number of worms at the attractant, the number at the counterattractant, and the total worms on the plate were recorded and chemotaxis indices calculated. The mean values at each concentration were computed for each timepoint and standard deviation error bars are shown (n = 17–29 plates per treatment group, as indicated on the graph). Replicate values are included only at 30 minutes since the same plates were counted at 30, 60, 90, and 120 min. ∗p < 0.05, ∗∗p ≤ 0.01, ∗∗∗p ≤ 0.001, compared to wild type.

