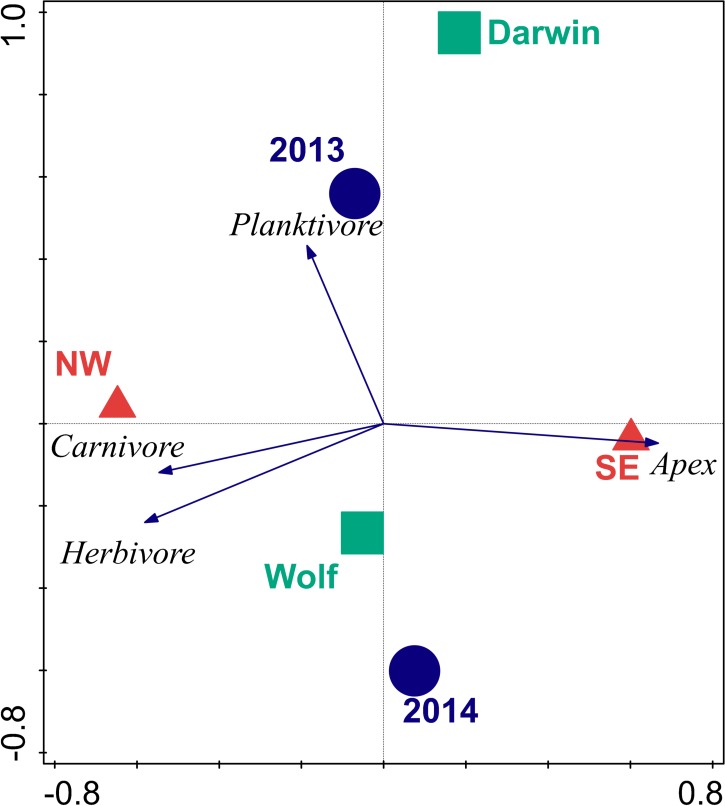
Figure 3. Bi-plot of results of redundancy analysis of fish trophic biomass with location, wave exposure, and year.
Blue circles represent the 2013 and 2014 data. Red triangles are orientations. Squares are centroids of Darwin and Wolf. Vectors are magnitude and directional effects of each trophic group on orientation of locations in ordination space.

