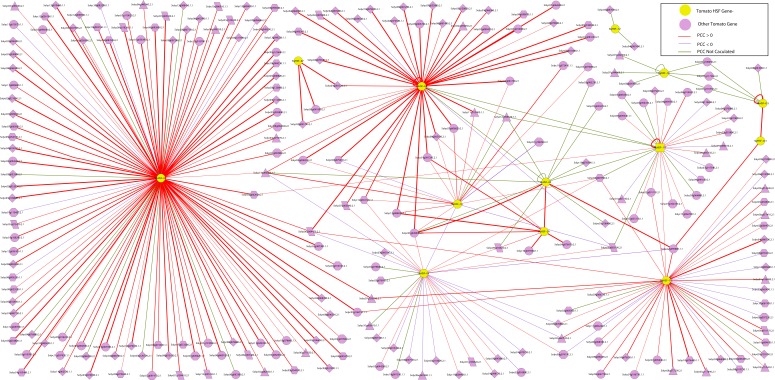
Figure 5. The interaction network of SlyHSF genes according to the networks in Arabidopsis.
The shape of gene boxes illustrated the location of this gene. The ellipse, hexagon, V, parallelogram, triangle, octagon and diamond represented other tomato genes in plasma, membrane, vacuole, plastid and peroxisome, cytosol, others and unclear, respectively. Red, purple and green lines indicated that the Pearson correlation coefficient (PCC) index were greater than 0, less than 0 and not calculated respectively. The boldness of the line indicated the PCC value between genes.

