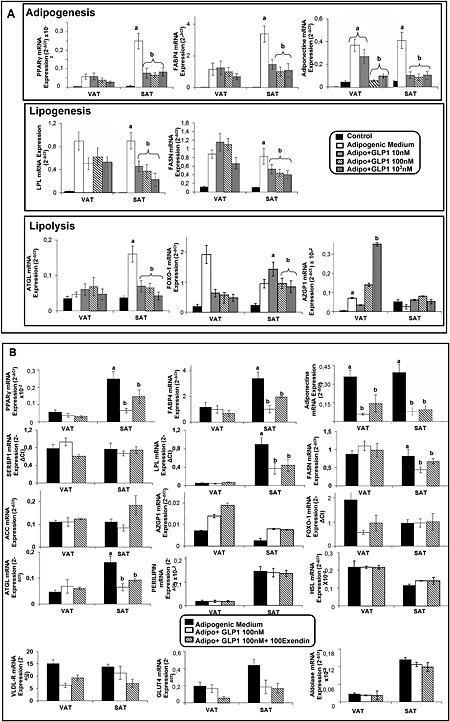
Figure 2.

Effects of GLP‐1 and GLP‐1 receptor antagonist exendin (9–39) on GLP‐1‐induced changes in the mRNA expression levels of adipogenic, lipogenic and lipolytic markers in in vitro differentiated human adipocytes from SAT and VAT. (A) SVFCs were isolated from human VAT and SAT samples obtained from obese subjects (n = 6); 14‐day differentiated adipocytes were exposed to GLP‐1 (10, 100 and 1000 nM) for 12 h. PPARγ, FABP4, adiponectin, LPL, FASN, α‐2‐glycoprotein 1, zinc binding (AZGP1), ATGL and forkhead box protein O1 (FOXO‐1) mRNA levels were normalized to cyclophilin mRNA levels. Results were obtained in triplicate for each patient and expressed as the mean ± SEM. Bars with different letters are significantly different according to ANOVA and Duncan's post hoc test. (B) In vitro differentiated adipocytes obtained from VAT and SAT samples of obese patients (n = 6) were incubated in the presence of 100 nM GLP‐1 in combination with 100 nM exendin (9–39) for 12 h at 37°C. The gene expression levels of PPARγ, FABP4, SREBP1, adiponectin, LPL, FASN, acetyl CoA carboxylase (ACC), AZGP1, ATGL, VLDL‐R, FOXO‐1, perilipin, HSL, GLUT4 and aldolase were measured by qRT‐PCR. mRNA levels of the genes investigated were normalized to cyclophilin mRNA levels. Results were obtained in triplicate for each patient and expressed as the mean ± SEM. Levene's test showed the homogeneity of variance. There were differences between treatments according to ANOVA and Duncan's post hoc test, and bars with different letters represent a significant difference according to Student's t‐test for independent samples.
