Figure 3.

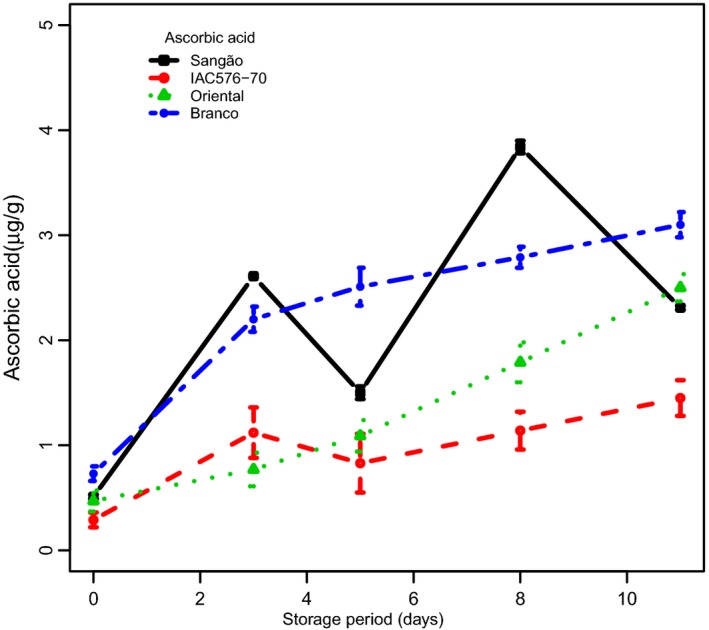
Changes in the concentrations of ascorbic acid in root samples of cassava cultivars during PPD. Each data point is presented as mean ± standard deviation (n = 3) in (μg g−1).

Changes in the concentrations of ascorbic acid in root samples of cassava cultivars during PPD. Each data point is presented as mean ± standard deviation (n = 3) in (μg g−1).