
Figure 7.
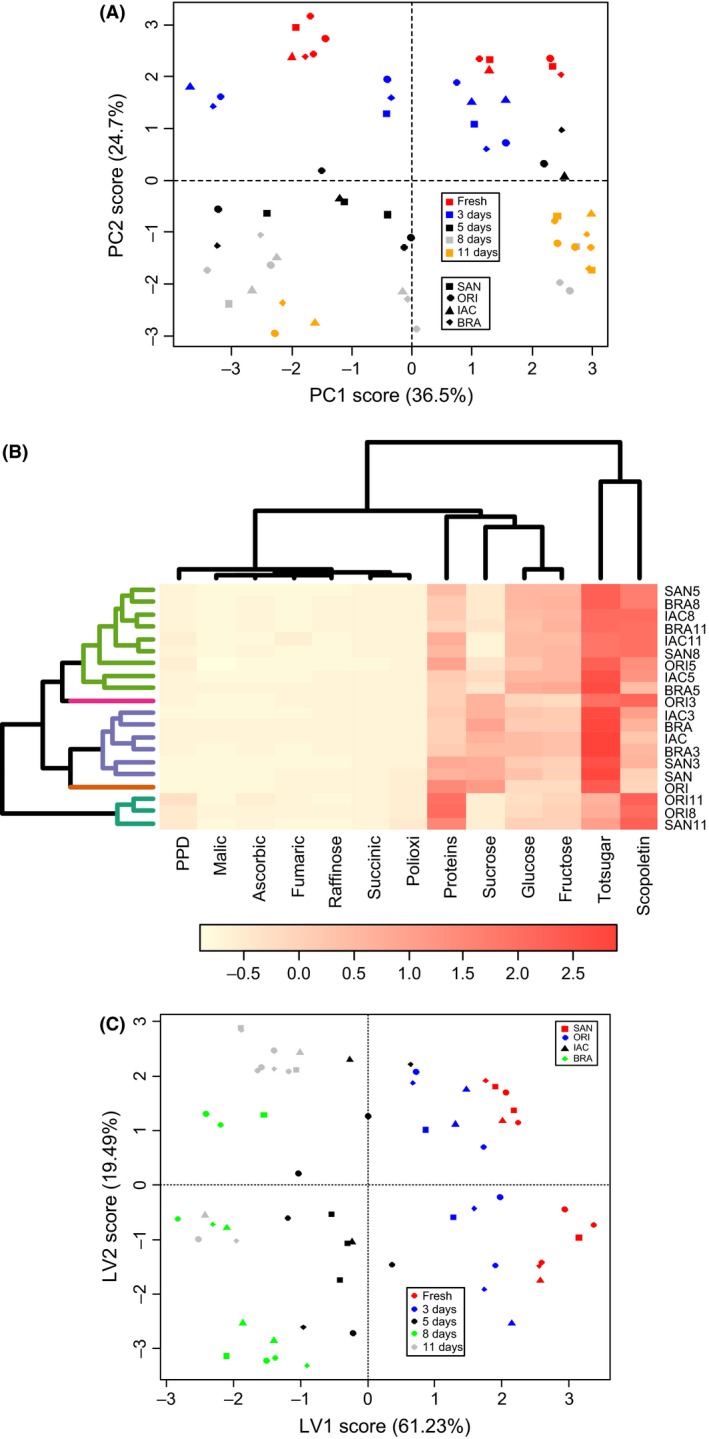
(A) Scores plot of a two‐component PCA model from the metabolic dataset of cassava roots showing sample clustering according to metabolic fingerprinting and the percentage of variance captured by each PC. (B) A seriated cluster heat map (HCA), with cophenetic correlation coefficient of 78.1%. (C) PLS‐DA components score plot of cassava samples during PPD, taking into consideration all the metabolites analyzed. PLS‐1 (x‐variate 1) = 61.23%; PLS‐2 (x‐variate2) = 19.43% of variance explained.