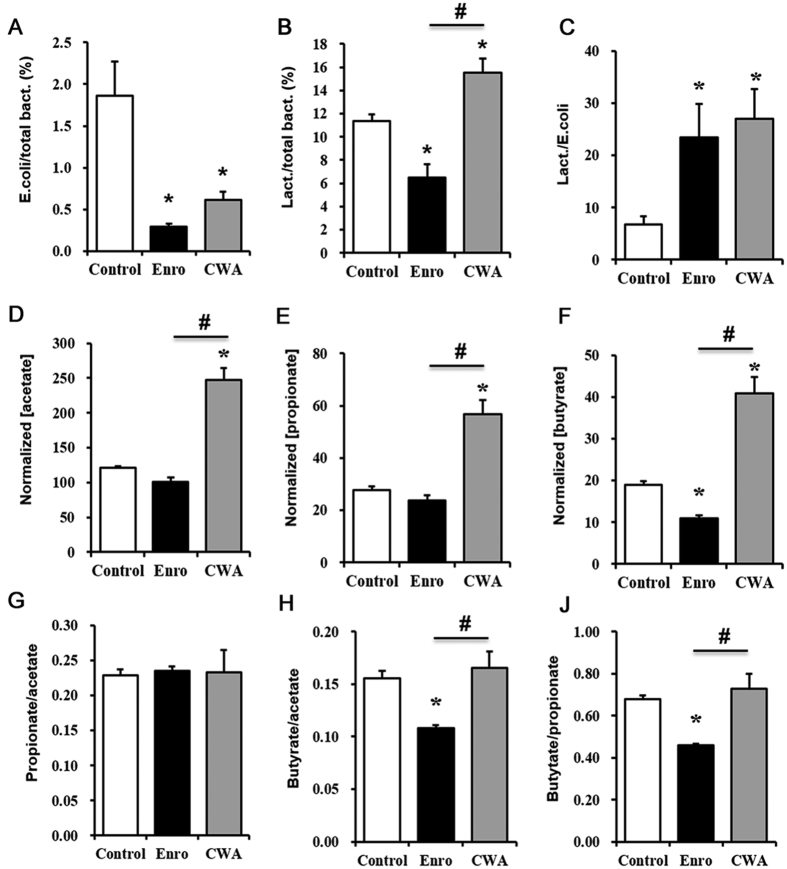
Figure 6. Cathelicidin-WA improved microbial composition and SCFA levels in feces.
Ratios of Escherichia coli to total bacteria (A), Lactobacillus to total bacteria (B), and Lactobacillus to Escherichia coli (C) in feces as detected by qPCR. The concentrations of acetate (D), propionate (E), and butyrate (F) in feces were determined by GS, and the data were normalized to feces weight (per gram). Ratios of propionate/acetate (G), butyrate/propionate (H) and butyrate/acetate (J). All data are expressed as the mean ± SEM (n = 6). Differences were determined by one-way ANOVA. Enro, Enrofloxacin; CWA, Cathelicidin-WA. *P < 0.05 compared with the control; #P < 0.05 CWA compared with Enro.

