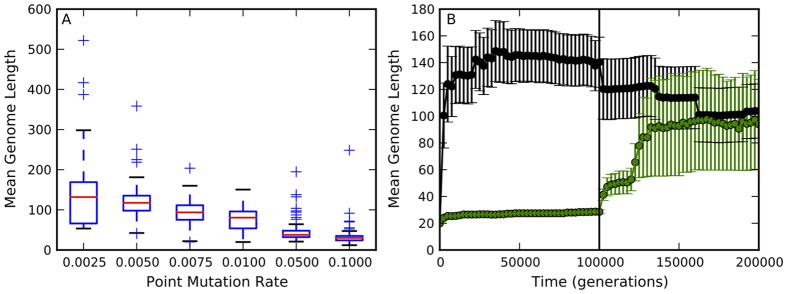
Figure 1. Point mutation rate is a strong determinant of genome size.
(A) Genome size and mutation rate are negatively correlated in asexual populations. The initial conditions, i.e. the ancestral genome and population size, were identical for all point mutation rates in our study (0.0025, 0.005, 0.0075, 0.01, 0.05, and 0.1). The avidian populations at the lowest mutation rate (0.0025) are still evolving (mean population fitness is still increasing, Supplementary Fig. S1) after 200,000 generations, explaining the higher variation in genome length for this mutation rate. Red lines are median values from 100 replicates, while the upper and lower bounds of the box are the third and first quartile, respectively. Whiskers are either 1.5 times the the quartile value or the extreme value in the data, whichever is closer to the median. Plus signs are outliers. (B) The direct link between point mutation rate and genome size is further reinforced by switching the point mutation rate of population evolving at 0.0025 to 0.1 after 100,000 generations (black circles), and vice versa (green circles). The black line represents the generation where the mutation rates were switched. The long genomes shrink when mutation rate is increased and short genomes expand when mutation rate is decreased. Error bars represent ±1 SE. Values represent the mean genome length across the population, averaged over 20 replicates.

