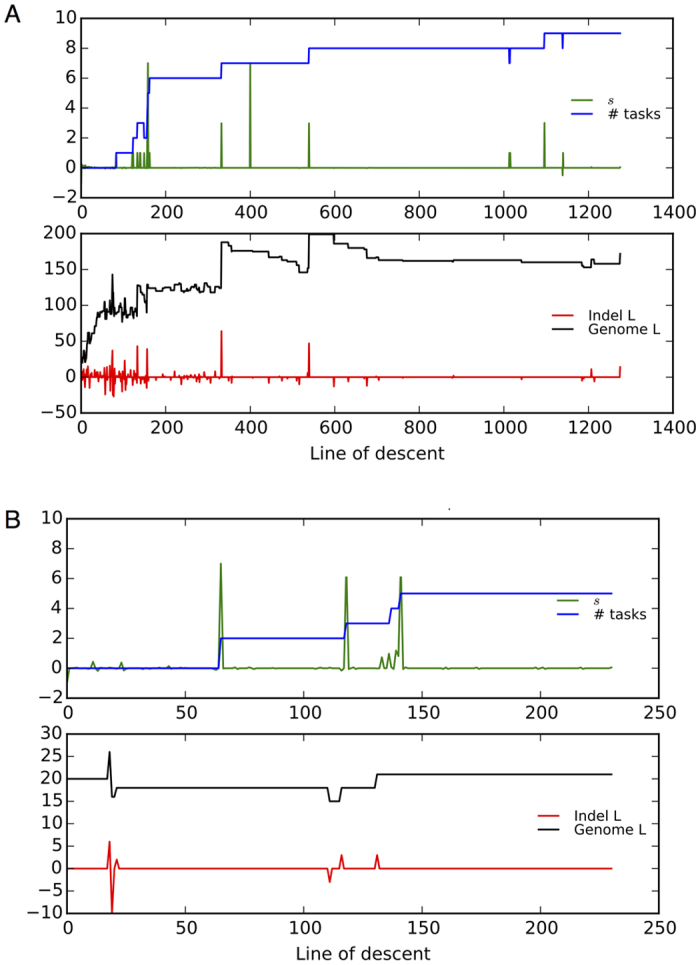
Figure 3.

The line of descent (LOD) of the most fit genome is shown for a single replicate population evolving at the lowest (0.0025, A) and the highest (0.1, B) point mutation rate in our study. The fitness effects of genome edit events (insertions, deletions, base substitutions) are shown in green, the number of evolved traits is shown in blue, the size of indels is shown in red, and the genome length is shown in black. At low mutation rate (top panel, A), new traits (in blue) often evolved following beneficial genomic events (green spikes), and are sometimes concurrent with insertion events (red spikes). These beneficial insertions appear to increase the genome size (black line) over time. At the high mutation rate (bottom panel, B), insertion events are not as frequent as at low mutation rates (also see Supplementary Fig. S4), with genome size staying relatively constant. The line of descent (LOD) maps for other mutation rates can be found in Supplementary Fig. S5.
