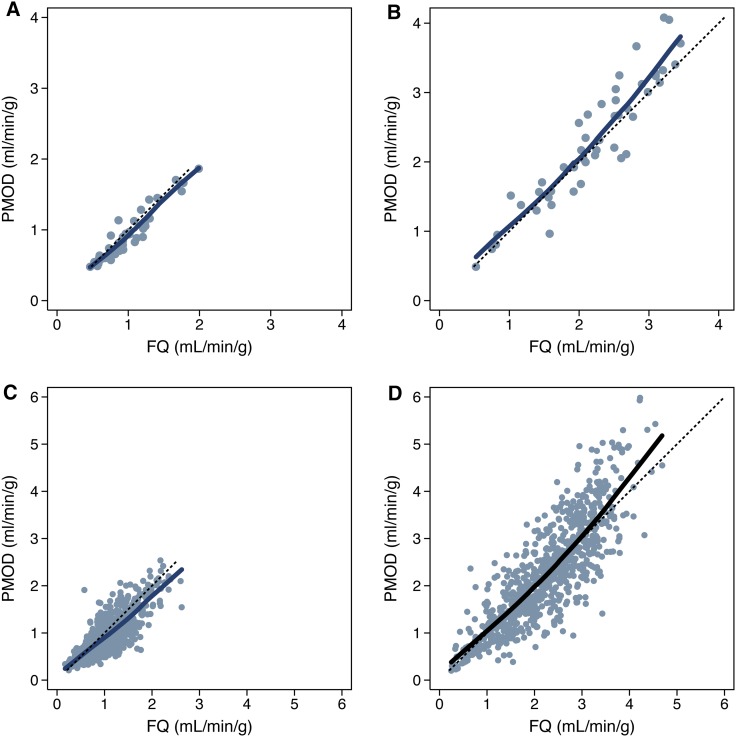
Figure 2.
Comparison of MBF values according to software package. Comparison of global left ventricular MBF values for (A) rest and (B) stress flows. Comparison at the 17-segment level with MBF values for (C) rest and (D) stress flows. The identity line (dashed, y = x) and the locally weighted regression curve (solid) are presented

